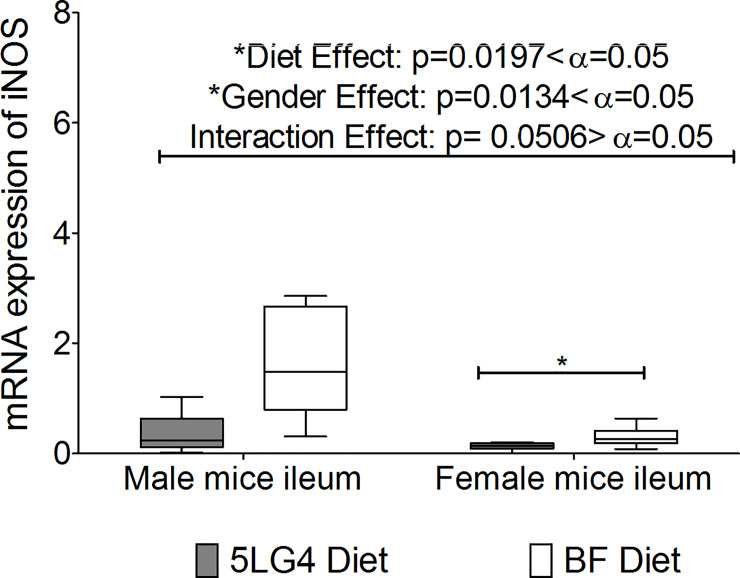
Fig 7. Comparison of iNOS expression between ileums of breadfruit (BF)-and 5LG4-fed mice.
* represents a significant difference between the two groups using 2 sample t-test at alpha level 0.05. Middle line denotes media, whiskers are determined by Tukey method, which represent largest value below 75th percentile plus 1.5 times interquartile distance IQR or lowest value above 25th percentile minus 1.5 times IQR.

