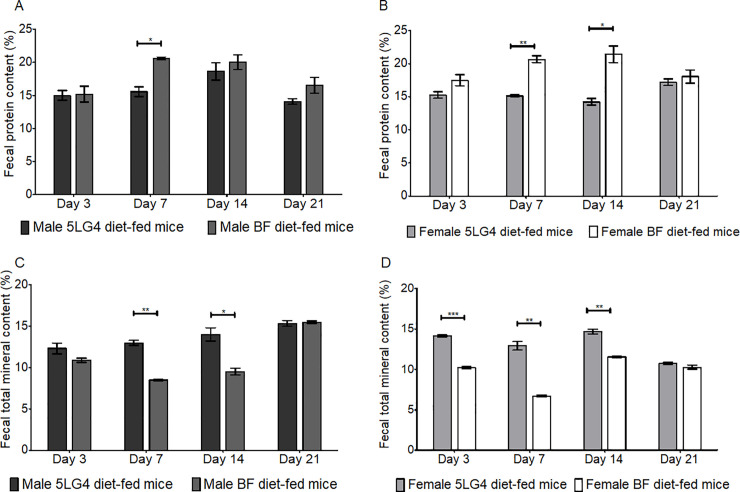
Fig 9. Comparison of fecal protein and total mineral content between breadfruit and 5LG4 diet fed mice.
(A) Fecal protein content in male mice. (B) Fecal protein content in female mice. (C) Fecal total mineral content in male mice. (D) Fecal total mineral content in female mice. Measurements were taken at Day 4, Day 7, Day 14, and Day 21. *, **, *** represent a significant difference between the two groups using 2 sample t-test at alpha level 0.05, 0.01, 0.001, respectively. Bars represent the standard error of the measurement among eight mice from the same group.

