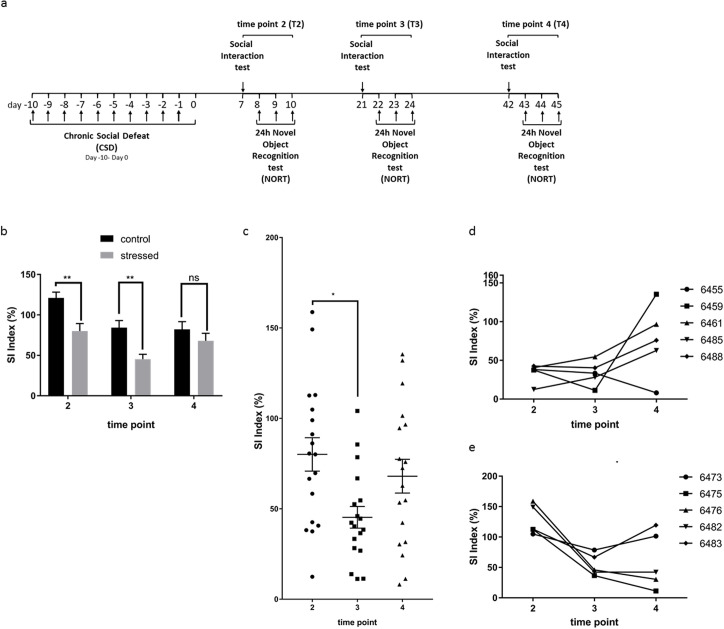
Fig 2. Longitudinal development of social interaction behavior after CSD stress.
(a) Experimental setup timeline for retesting. Animals of a cohort of mice were (re-)tested for SI and NORT at 7–10 days (T2), 21–24 days (T3) and 42–45 days (T4) post CSD. (b) Re-testing of social interaction behavior at T2-T4 of non-stressed and stressed animals (T2 p = 0.0026, T3 p = 0.0045, T4 p = 0.7145, 2-way repeated measures ANOVA and Bonferroni’s post hoc test). SI indices of control animals significantly decreased at time points T3 and T4 compared to T2 (T2 vs T3 p = 0.008, T2 vs. T4 p = 0.005, T3 vs. T4 p > 0.999, 2-way repeated measures ANOVA followed by Bonferroni’s post-hoc test) (c) Group dynamics of social interaction behavior in stressed mice at three different time points (T2-T4). SI scores were significantly lower at T3 compared to T2 and recovered at T4 (T2 vs. T3 p = 0.017, T2 vs. T4 p = 0.977, T3 vs. T4 p = 0.197, 2-way repeated measures ANOVA followed by Bonferroni’s post-hoc test). (d) Longitudinal trajectories of stressed animals at T2-T4 of the 5 worst performers chosen at T2. (e) Longitudinal trajectories of stressed animals at T2-T4 of the 5 best performers chosen at T2. Data are shown as mean ± standard error of the mean and individual values.

