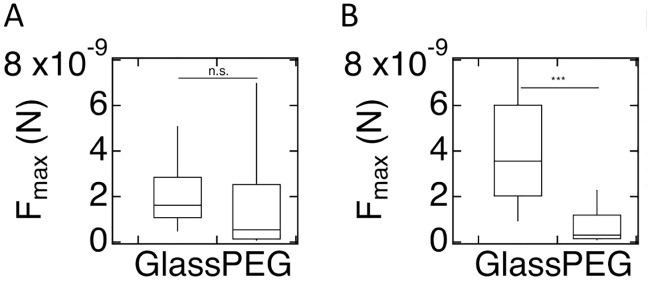
Fig 7. Maximum force of adhesion for developed cells.
A) Box plot of the distribution of Fmax for WT AX2 cells on glass and PEG-gel surface, where the bottom and the top of the box represents the first and the third quartiles, and the band corresponds to the median. The difference in Fmax is not significant. B) As in A, but now for WT AX4 cells. For these cells, the difference in Fmax is significant.

