
Figure 4. Cell-Intrinsic Defect in PD-1-Deficient CD8+ T Cell Memory Is Observed in Multiple Intranasal Infections.
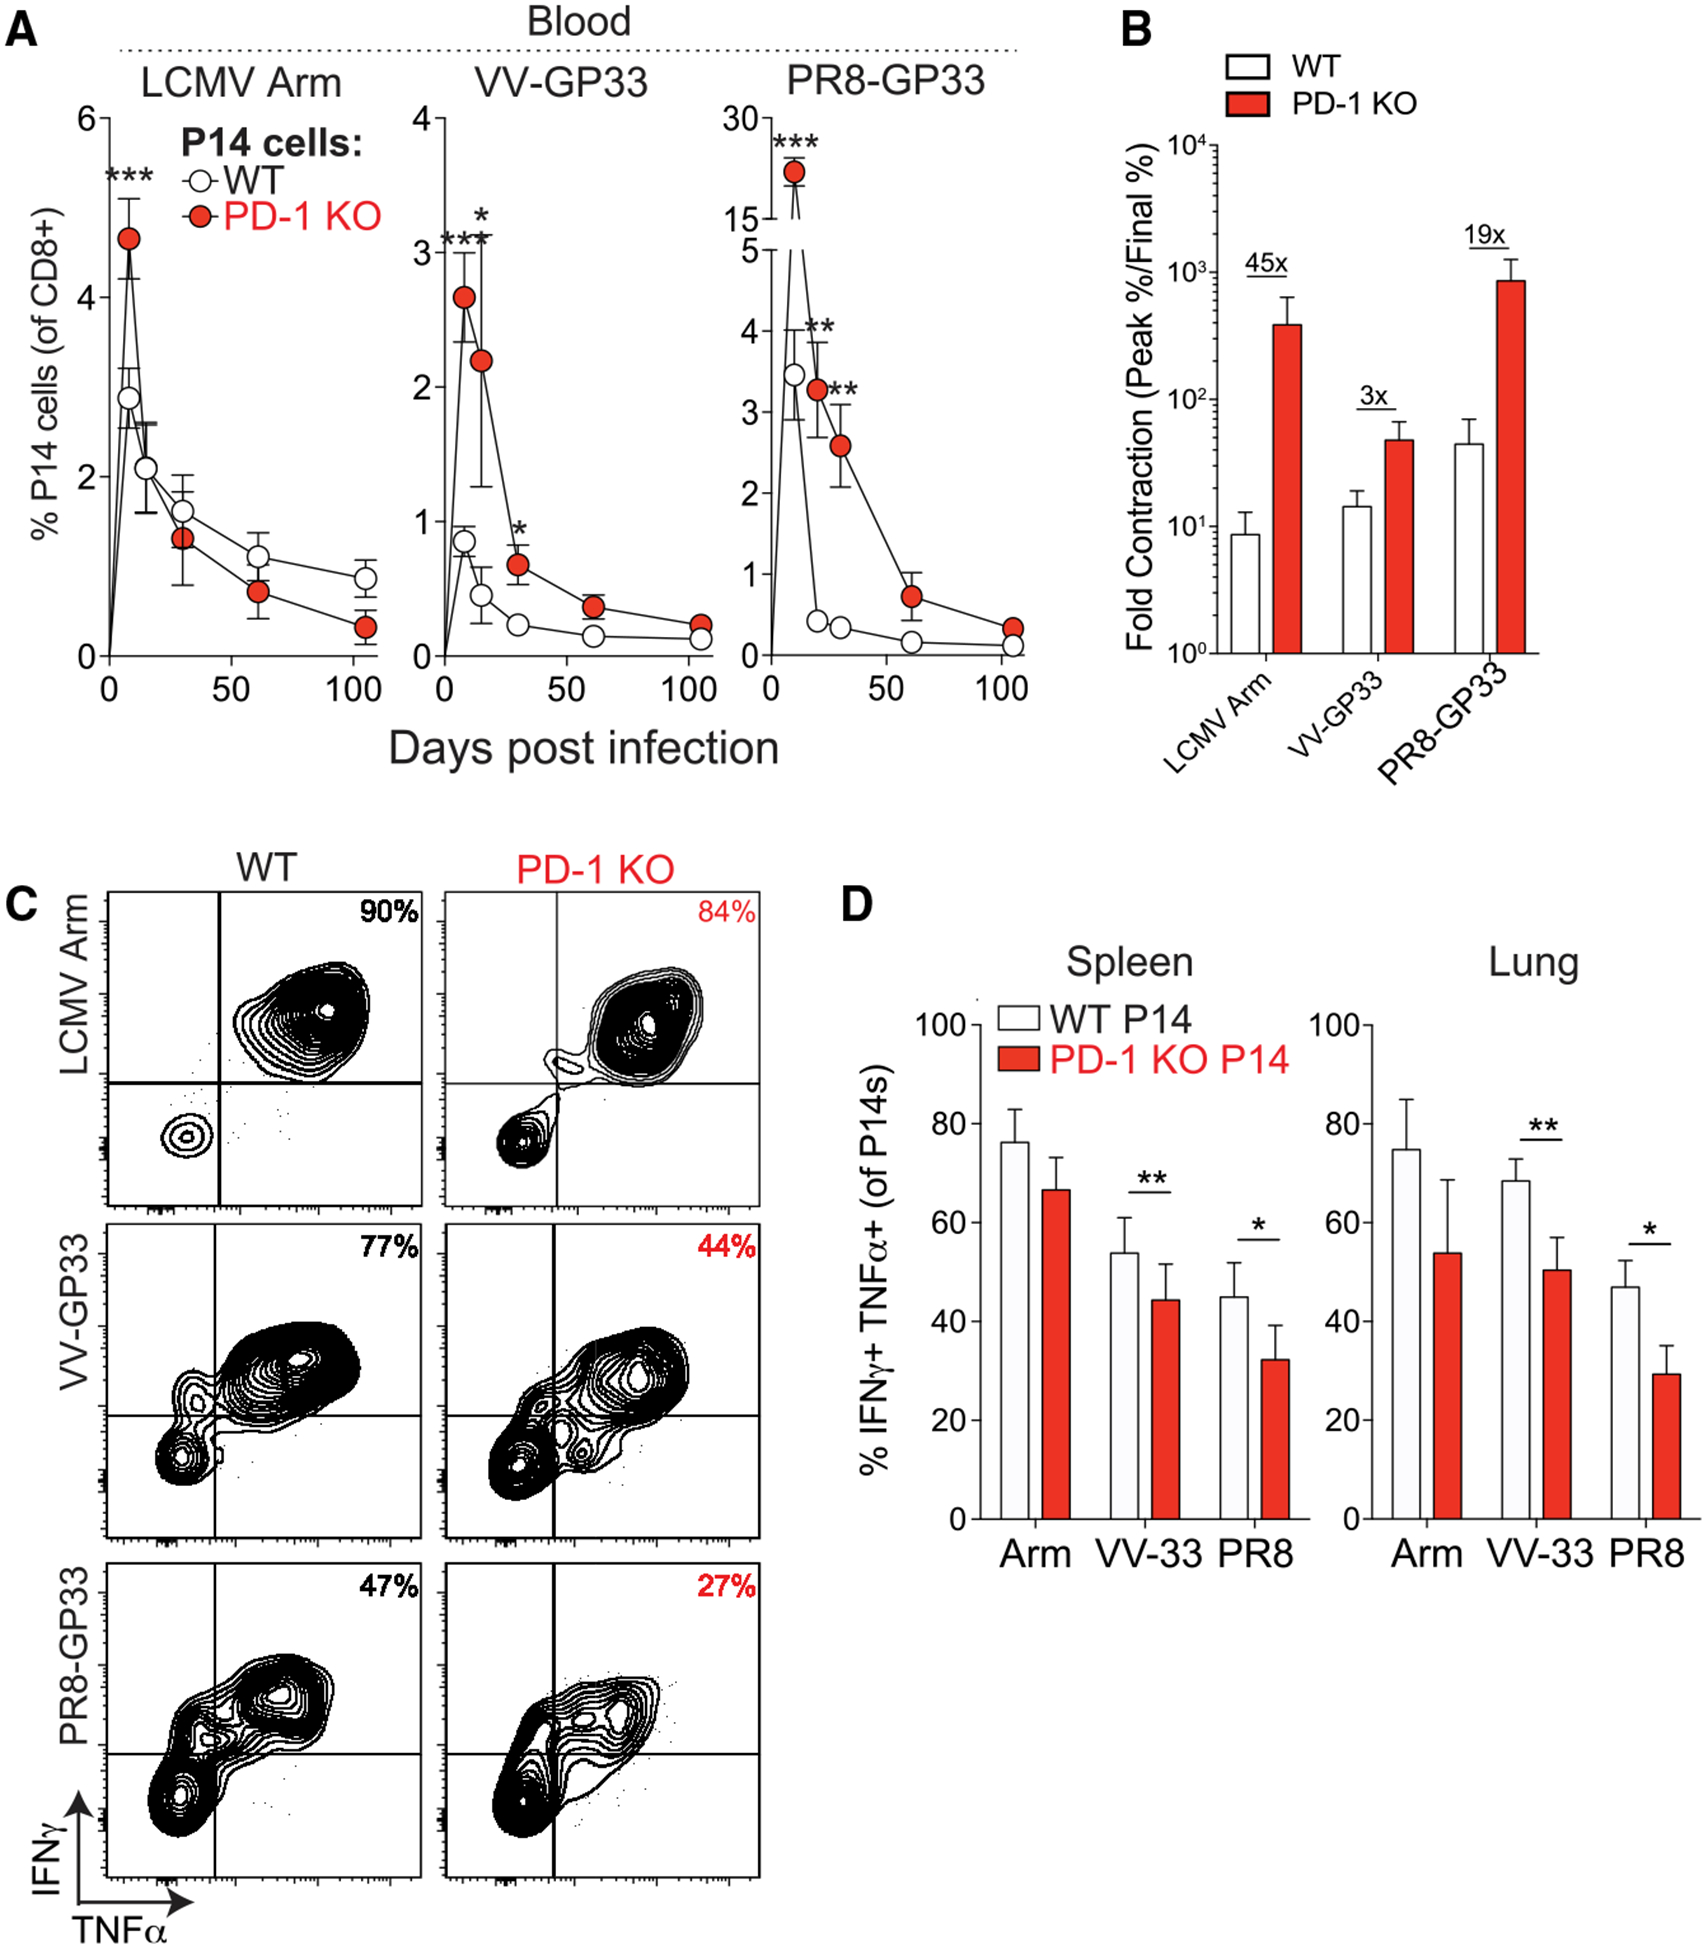
(A) Frequencies of WT and PD-1 KO P14 cells in mixed chimeras in the peripheral blood following primary intranasal infections with LCMV Armstrong, VV-GP33, or PR8-GP33. (B) Individual bars show fold changes in frequencies of WT and PD-1 KO P14 cells between day 8–10 and day 100+ from mice in (A). Numbers above bar graphs indicate the difference in ratios observed in WT versus PD-1 KO P14 cells. (C and D) Representative plots (C) and summary (D) of frequencies of IFN-γ+ TNF-α+ P14 cells at day 100+ p.i. Summary data (D) in the spleen (left) and lung (right) are shown. Data are representative of 2 independent experiments with 4–5 mice per group and represented as mean ± SEM. Significance was assessed using Student’s t test; ns, not significant; *p < 0.05, **p < 0.01, ***p < 0.001. Arm, LCMV Armstrong; PR8, PR8-GP33.