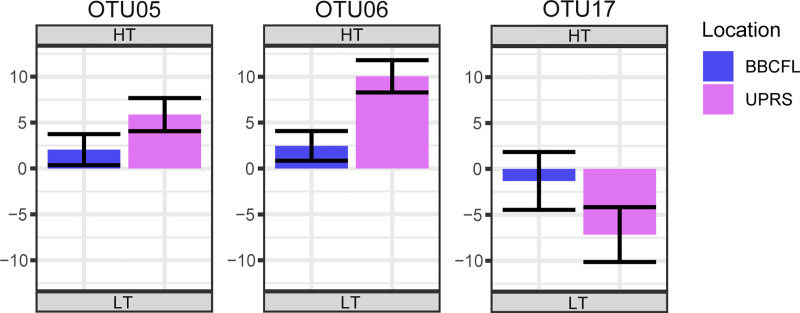
Fig 1. Statistically significantly (q≤0.05) different abundant fungal OTUs considering interactions of location (BBCFL, UPRS) and tolerance group (HT, LT) as an effect where effects due location had the same direction.
The differences in abundance of fungal OTUs are shown as log2 fold changes for each tolerance interaction. Positive values represent higher abundance in HT cattle, negative values represent higher abundance in LT cattle. Bars in blue and purple represent farms BBCFL and UPRS, respectively. Error bars represent the 95% confidence interval.

