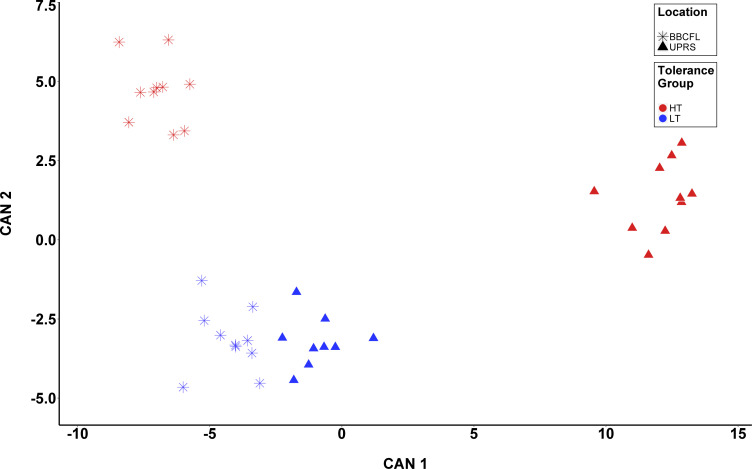
Fig 4. Canonical discriminant analysis (CDA) for response to fescue toxicosis.
CDA was performed to discriminate animals based on the combination between tolerance group (T; High [HT] and Low [LT] tolerance groups) and location (BBCFL and UPRS) using 14 fungal and bacterial OTUs. Each point represents the canonical score (CS) of each animal based on the respective canonical variable (CAN). The x-axis represents CAN 1 and the y-axis CAN 2. Red and Blue points represent HT and LT animals, respectively, whereas triangles and stars represent animals from UPRS and BBCFL, respectively.

