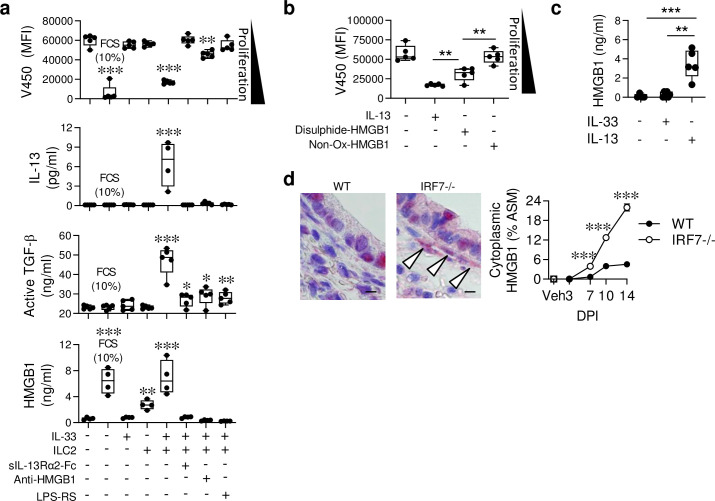
Fig 5. Activated ILC2s induce ASM proliferation in vitro in an HMGB1-dependent manner.
(a-b) Primary ASM cells were isolated from naïve WT neonatal mice and cultured with ILC2s (purified from the lungs of IRF7-/- mice at 10 dpi) in the presence of various stimuli as indicated. (a) ASM proliferation (indicated by decreasing median fluorescence intensity (MFI)), IL-13, active TGFβ and HMGB1 concentration in the culture supernatant. * Compared to ASM cells cultured in the absence of ILC2s or cytokine stimulation. (b) ASM proliferation in response to IL-13 (3 ng/ml), disulphide HMGB1 (30 ng/ml), or a non-oxidisable mutant HMGB1 (30 ng/ml). * Compared to IL-13-stimulated ASM cells with disulphide-HMGB1-stimulated ASM cells or disulphide-HMGB1-stimulated ASM cells with non-oxidisable mutant HMGB1-stimulated ASM cells as indicated. (c) HMGB1 protein expression in the supernatant of ASM cells cultured in the presence of IL-33 or IL-13 as indicated. (d) Representative micrograph (x1000 magnification) of HMGB1 immunoreactivity (red) in the lung at 10 dpi, arrows indicate expression by ASM cells. Bar, 5 μm. Quantification of HMGB1 expression by ASM cells. For panel a-d, data are representative of one experiment, performed twice with similar results. For panel e, data are representative of n = 2 experiments with four to eight neonates in each group. Data are presented as box-and-whisker plots showing quartiles (boxes) and range (whiskers; a-d) or as mean ± SEM (e [right]). Data were analysed by One-way ANOVA with Dunnett post hoc test (a-d) or Two-way ANOVA with Tukey post hoc test (e ([right]; *, P < 0.05; **, P < 0.01; ***, P < 0.001 compared to the respective control group.

