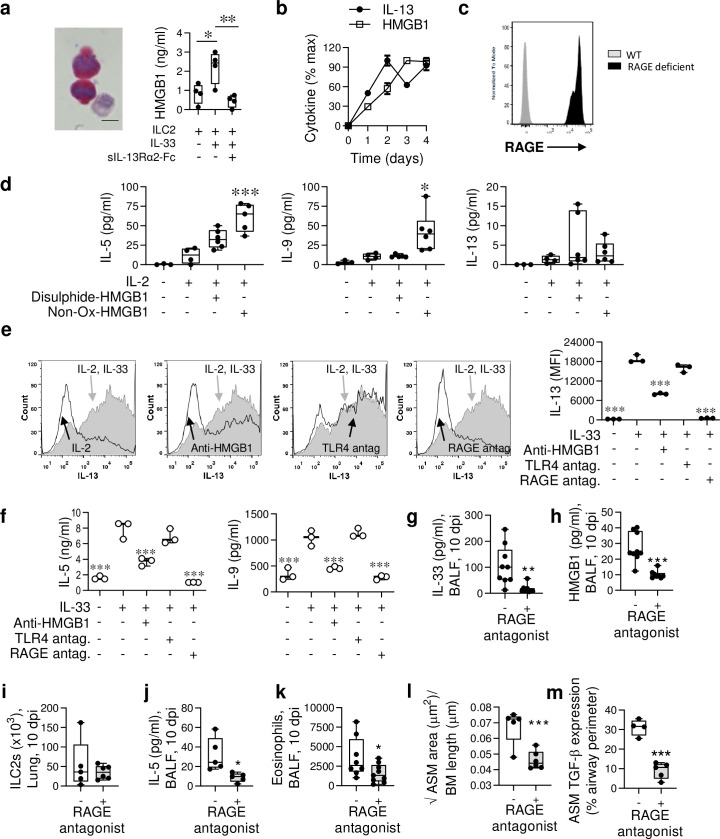
Fig 6. HMGB1/RAGE axis amplifies ILC2 type-2 cytokine production and contributes to ASM growth in vivo.
(a [left]) Lung ILC2s were purified from IRF7-/- mice at 10 dpi and cultured with IL-2 for 4 days. Representative micrograph (x1000 magnification) of HMGB1 expression (red) in IL-33 stimulated ILC2s. Bar, 5 μm. (a [right]) HMGB1 levels in the culture supernatant after a 4 day culture +/- IL-33 (3 ng/ml) and +/- sIL-13Rα2 (5 μg/ml) as indicated. (b) IL-13 and HMGB1 protein expression by ILC2s. (c) RAGE expression detected by flow cytometry in lung ILC2s. (d) IL-5, IL-9 and IL-13 protein expression by lung ILC2s purified from IRF7-/- mice cultured in IL-2 +/- difulphide-HMGB1 (30 ng/ml) or non-oxidisable mutant HMGB1 (30 ng/ml) as indicated. * Compared to IL-2-stimulated ILC2s. (e) Lung ILC2s purified from 4C13R IRF7-/- mice were cultured in IL-2 +/- IL-33, and treated with anti-HMGB1 (Clone 2G7, 5 μg/ml), TLR4 antagonist (LPS-RS 1 μg/ml) and RAGE antagonist (FPS-ZMI; 300 nM) as indicated. DsRed (IL-13) intensity was quantified by flow cytometry. * Compared to IL-2/IL-33-stimulated ILC2s. (f) IL-5 and IL-9 production by ILC2s, treated as described in panel e. (g-m) IRF7-/- mice were inoculated with PVM as described in Fig 2, and treated daily from 3–10 dpi with a RAGE antagonist (FPS-ZM1). (g) IL-33 and (h) HMGB1 protein expression in BALF. (i) Lung ILC2s, (j) IL-5 protein in BALF, (k) Eosinophils in BALF, (l) ASM area, and (m) Quantification of TGF-β1 expression by ASM cells. For panel a-f, data are representative of one experiment, performed twice with similar results. For panel g-m, data are representative of n = 2 experiments with 4–9 mice in each group and are presented as box-and-whisker plots showing quartiles (boxes) and range (whiskers; a [right], d, g-m) or as mean ± SEM (b) or as scatter plot (e [right]-f). Data were analysed by One-way ANOVA with Dunnett post hoc test (a, d, e [right]-f) or T-test (g-m); *, P < 0.05; **, P < 0.01; ***, P < 0.001 compared to the respective control group.

