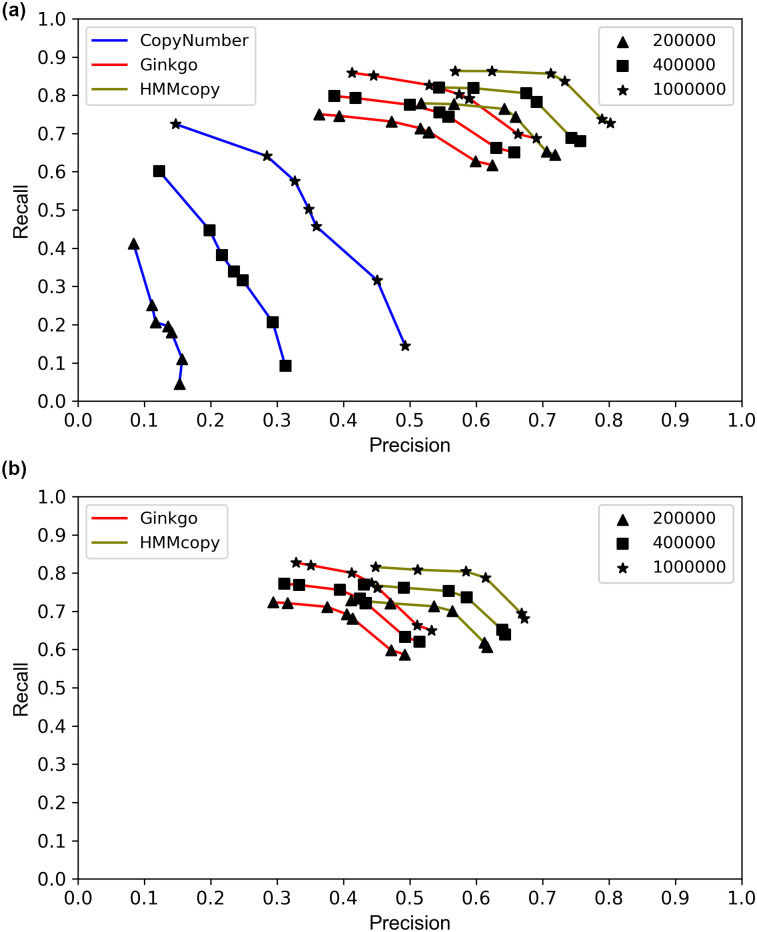
Fig 1. ROC curves of the three methods HMMcopy, Ginkgo, and CopyNumber.
(a) Coarse-grained analysis results, and (b) fine-grained results. For each method, the results based on three thresholds of correctness are plotted. For HMMcopy, nu, which controls the suggested degree of freedom between states, was tuned to take on the values 0.01 (rightmost), 0.1, 2.1 (the tool’s default), 4, 10, and 20 (leftmost). For Ginkgo, alpha, which controls the significance level to accept a change point, was tuned to take on the values 1e-1000 (rightmost), 1e-100, 1e-10, 1e-5, 1e-4, 1e-3, 1e-2 (the tool’s default), 0.02 and 0.05 (leftmost). The dots corresponding to values 1e-5 and 1e-10 in coarse-grained analysis overlap. For CopyNumber, gamma, which is the weight of the penalty on changing a state, was tuned to take on the values 40 (rightmost, and the tool’s default), 10, 5, 4, 3, 2, and 1 (leftmost).

