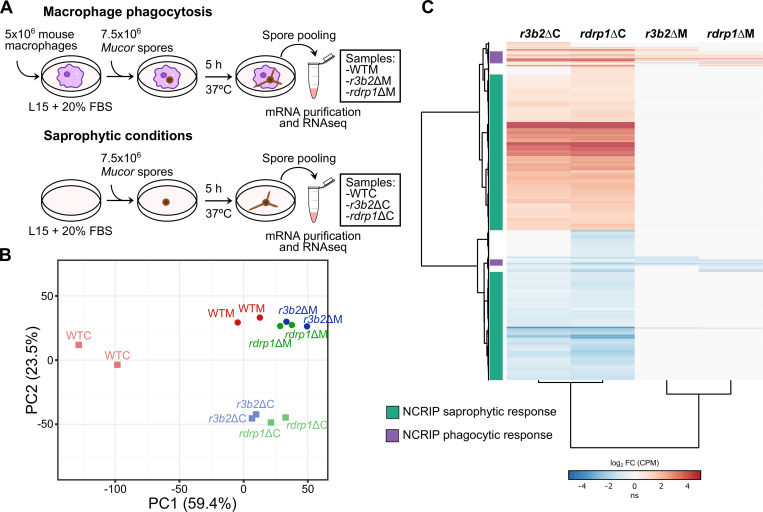
Fig 1. NCRIP regulates a vast gene network via the cooperation of R3B2 and RdRP1.
(A) Diagram of the experimental design followed to perform macrophage phagocytosis and saprophytic assays for RNA sequencing. (B) Principal component (PC) analysis biplot of transcript abundances (measured as counts per million [CPM], mean CPM > 1.0), showing the variability across the color- and shape-coded samples. (C) Heatmap of significant differentially expressed genes (DEGs, log2 FC ≥ |1.0|, FDR ≤ 0.05) in the depicted NCRIP mutant strains and conditions compared to the wild-type strain in the same condition as a log2 ratio. Differential expression values and experimental samples are clustered by similarity. All DEGs responding exclusively in the saprophytic condition in both NCRIP mutants are clustered in green. DEGs in at least one NCRIP mutant responding to macrophage phagocytosis are depicted in purple. Differential expression values (in log2 CPM) are color-coded in red for upregulation and blue for downregulation (ns stands for non-significant changes).

