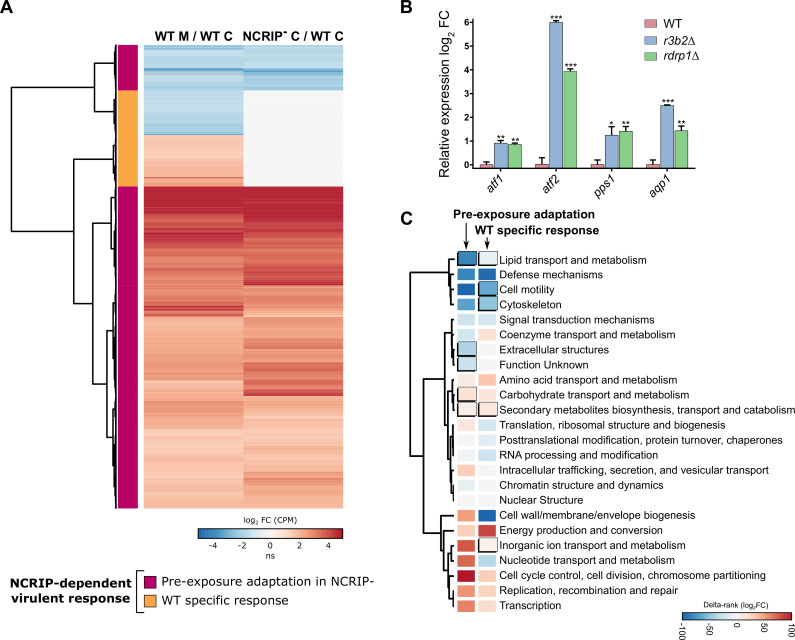
Fig 4. NCRIP controls the response to macrophage phagocytosis by inhibiting its targets under non-stressful conditions.
(A) The NCRIP-dependent virulent response is depicted in a heatmap. Genes are clustered by similarity to compare the response to phagocytosis in the wild-type strain and the response of the NCRIP mutants in saprophytic conditions. This comparison reveals a pre-exposure adaptation of the NCRIP mutants (magenta cluster), showing similar expression values than the wild-type response to phagocytosis. Exclusive genes of the wild-type response are clustered together (orange cluster). Differential expression values (in log2 CPM) are color-coded to depict the degree of upregulation (red) or downregulation (blue) in each condition (ns stands for non-significant changes). (B) Bar plot of atf1, atf2, pps1 and aqp1 expression differences in r3b2Δ, and rdrp1Δ mutant strains compared with the wild-type strain in non-stressful conditions, i.e., incubation in cell-culture medium without macrophages for 5 hours. Log2 fold-change differential expression levels were quantified by RT-qPCR and normalized using rRNA 18S as an internal control. Error bars correspond to the SD of technical triplicates and significant differences are denoted by asterisks (* for P ≤ 0.05, ** for P ≤ 0.005, and *** for P < 0.0001 in an unpaired t-test). (C) KOG class enrichment analysis of the NCRIP-dependent virulent response during macrophage interaction is grouped in pre-exposure adaptation in NCRIP mutants and wild-type specific responses. Significant enrichments (Fisher’s exact test, P ≤ 0.05) are shown as uplifted rectangles. A measure of up- (red) or downregulation (blue) of each KOG class is represented as a colored scale of delta-rank values (the difference between the mean rank differential expression value of all genes in a particular KOG class and the mean rank differential expression value of all other genes). KOG classes are clustered according to the similarity of their delta rank values.

