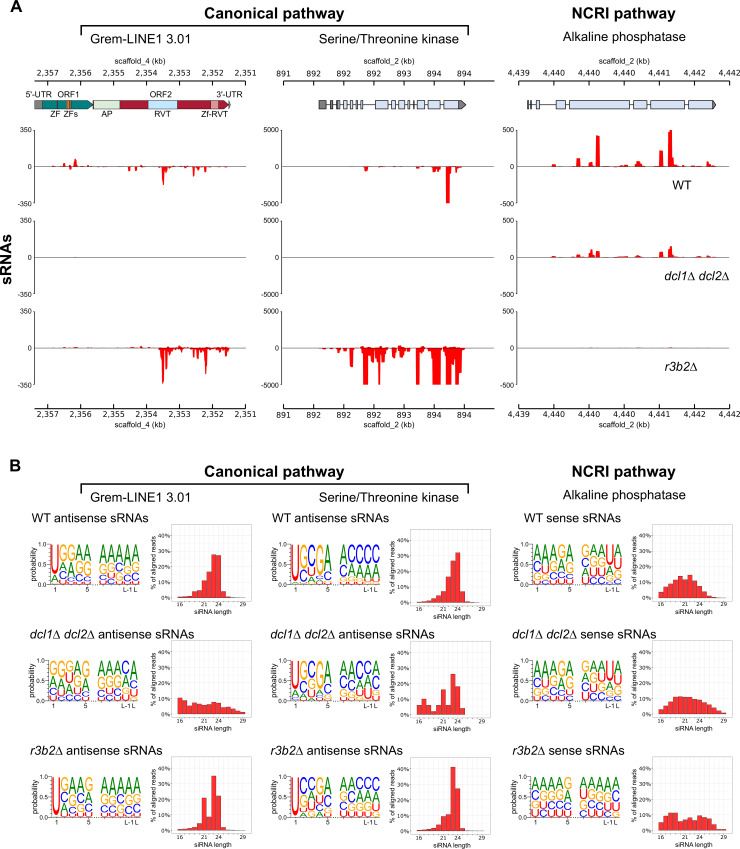
Fig 7. Transposable element sRNAs exhibit typical characteristics of the canonical RNAi pathway biogenesis.
(A) Representative diagram of sRNA production in the canonical and NCRI pathways. The canonical pathway is represented in two loci: Grem-LINE1, and a Serine/Threonine kinase (JGI Muccir1_3 ID: 1455000) [17]. NCRIP is exemplified by an Alkaline phosphatase (JGI Muccir1_3 ID: 1469159) [10]. Sense (positive values) and antisense (negative values) sRNAs accumulation is shown; sRNA values are normalized to bins per million (BPM) mapped reads. Grem-LINE1 open reading frames (ORF1 and ORF2 as green and red arrows, respectively) and protein domains predicted from its coding sequence are shown as colored blocks (zf-RVT, zinc-binding in reverse transcriptase [PF13966]; RVT, reverse transcriptase [PF00078]; AP, AP endonuclease [PTHR22748]; and ZF, zinc finger [PF00098 and PF16588]). (B) Sequence analysis of sRNAs mapping to the three loci shown in (A), produced in a wild-type, dcl1Δ/dcl2Δ, and r3b2Δ mutant strains. Each sequence analysis depicts a probability logo (showing the first and last five nucleotides) and a size distribution bar plot.

