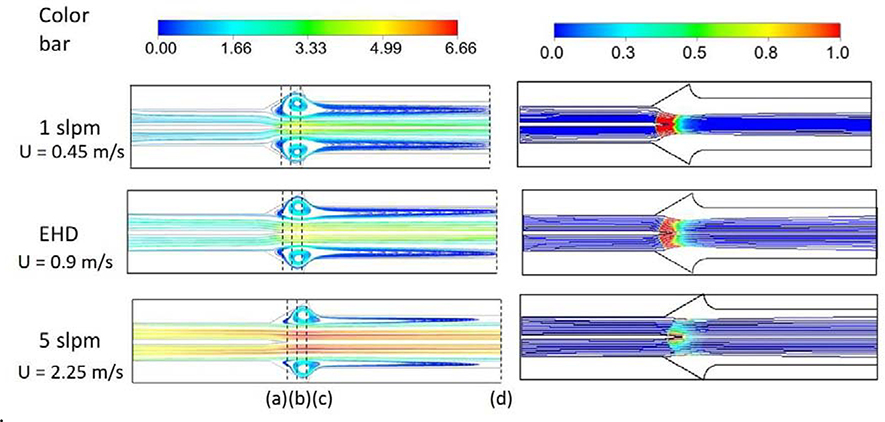
Fig. 7.
Left: Velocity streamlines colored by velocity magnitude. Right: non-dimensional parameter X (right) plotted on path lines for 1 slpm, EHD (~2 slpm), and 5 slpm flowrates. The dash lines indicate the location at which velocity profiles are compared (See SI Fig. 4).

