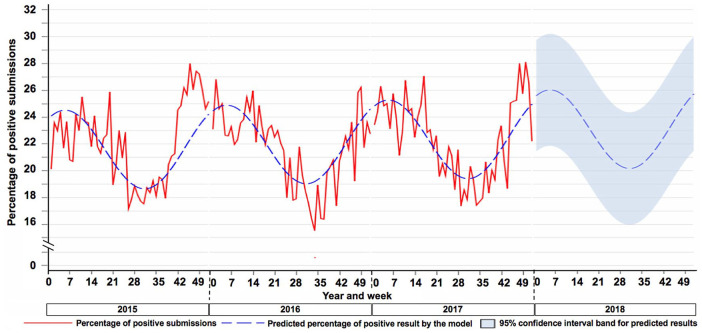
Figure 2.
Predicted value and 95% confidence interval (CI) for the 2018 forecasted percentage of submissions tested positive for porcine reproductive and respiratory syndrome virus. Dashed blue line = predicted weekly percentage of positive results. Continuous red line = observed percentage of weekly positive submissions for 2015–2017. 2018 blue band = 95% CI for the weekly predicted percentage of positive results.

