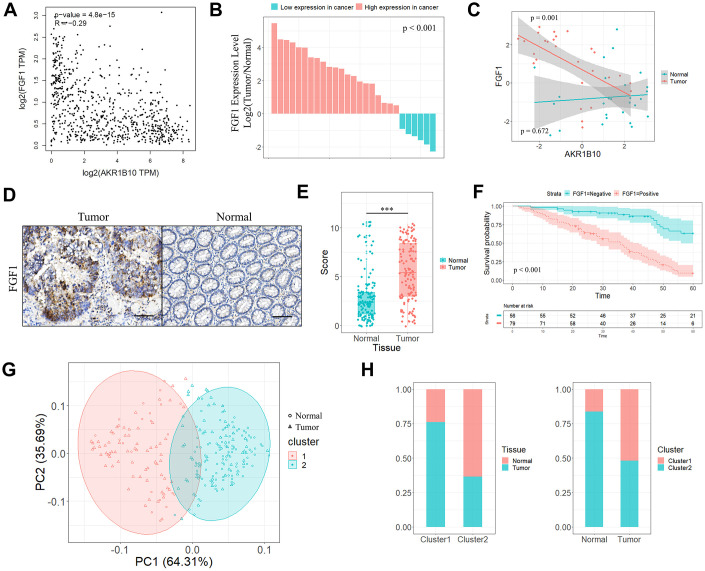
Figure 3.
Correlation between AKR1B10 and FGF1 in CRC tissues. (A) Correlation analysis of AKR1B10 and FGF1 levels in CRC tissues from TCGA datasets by GEPIA platform. (B) FGF1 mRNA levels in 27 paired CRC and normal tissues. (C) Correlation between AKR1B10 and FGF1 levels in the above. (D) Representative IHC images showing in situ FGF1 expression in CRC and normal tissues (scale bar = 100μm) and (E) corresponding IHC scores. (F) OS of 135 CRC patients demarcated by FGF1 expression levels. (G) Stratification of 135 pairs of CRC and normal tissues into cluster 1 (red) and cluster 2 (green) according to AKR1B10 and FGF1 IHC scores. (H) Percentage of tumor and normal samples in each cluster. CRC, colorectal cancer. OS, overall survival. *** P < 0.001.

