
Figure 3.
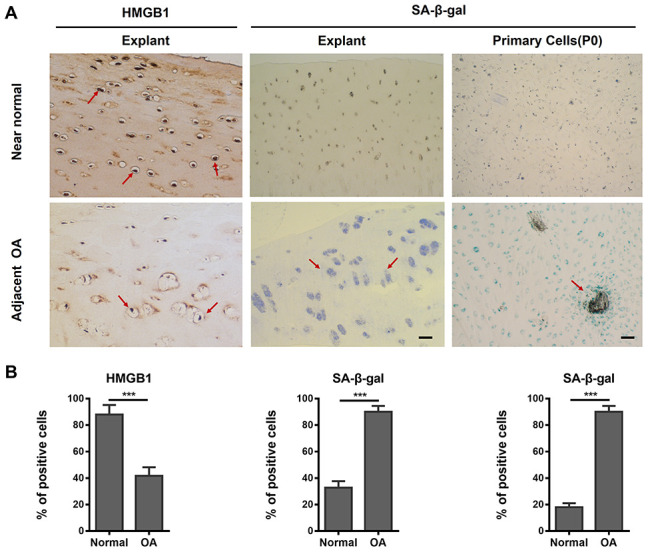
The presence of senescent human chondrocytes (SnCs) in adjacent normal and advanced osteoarthritic articular cartilage. (A) Representative images of HMGB1-positive non-SnCs (brown staining at red arrows, scale bars, 100 μm) by immunohistochemistry and SA-β-gal-positive SnCs expression on OA articular cartilage, OA chondrocytes (P0) and adjacent normal cartilage. (B) The statistical analysis of the percentage of SA-β-gal and HMGB1 positive cells from three independent experiments. Scale bar: 100 μm.