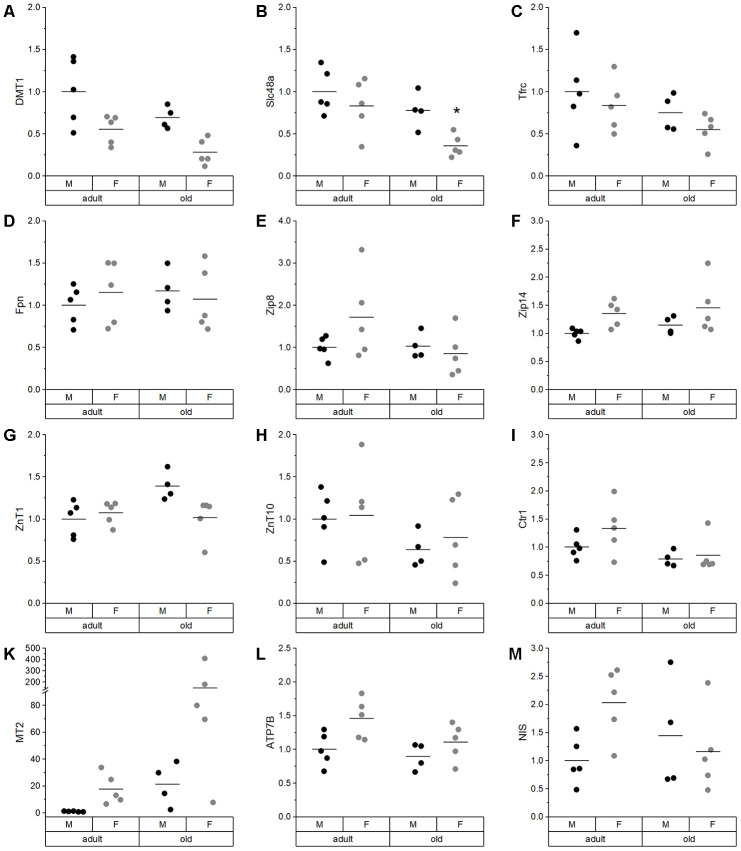
Figure 4.
Expression analysis of various TE-related genes in liver. Relative expression levels of TE-related genes in the liver of adult (24 weeks) and old (109-114 weeks) male and female mice (n = 4-5) fed with a chow diet ad libitum. Expression levels were normalized by a composite factor based on the house-keeping genes Hprt and Rpl13a. Finally, variances are expressed as fold change compared to adult males (mean adult males = 1). Statistical testing based on Two-Way ANOVA and post hoc analysis using Bonferroni’s test with * p < 0.05.

