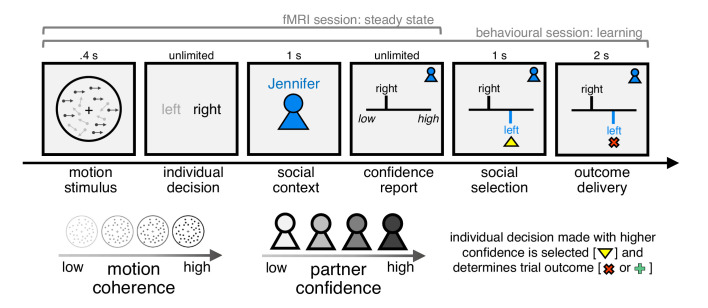
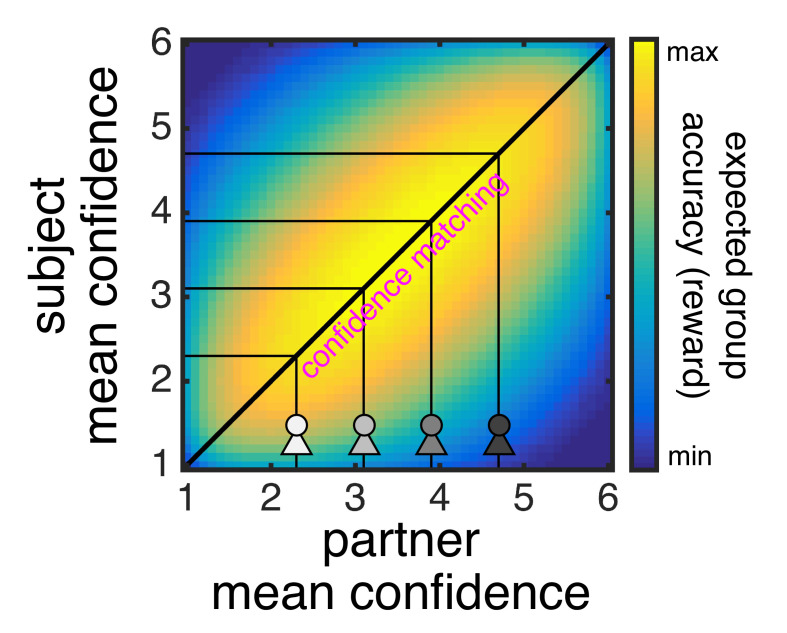
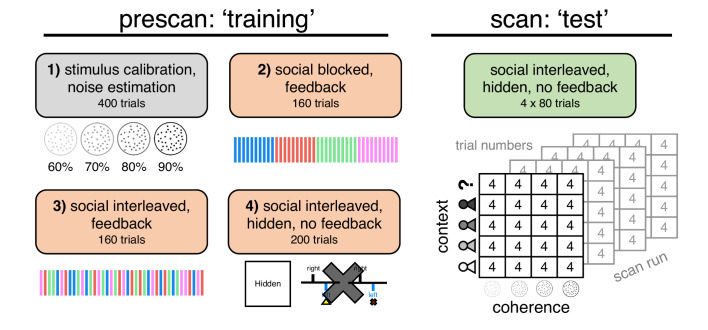
Figure 1. Experimental framework for dissociating private and public confidence.
On each trial, subjects made a perceptual group decision with one of four partners. They first decided whether a random dot motion stimulus was moving left or right. We varied the fraction of coherently moving dots in order to manipulate subjects’ internal sense of confidence in their decision. Subjects were then informed about their partner on the current trial and were asked to submit a report of confidence in their initial decision (discrete scale from 1 to 6). Subjects were then shown the partner’s response, after which the individual decision made with higher confidence was selected as the group decision. Finally, subjects received feedback about choice accuracy, before continuing to the next trial. We engineered the partners to have the same choice accuracy as subjects but to differ in mean confidence. Subjects were incentivised to help each group achieve as many correct decisions as possible: they were told that we would randomly select two trials for each group in each session (4 × 2 × 2 = 16 trials) and pay £1 in bonus for every correct group decision (in reality, all subjects received £10 in bonus). In this design, the strategy for maximising group accuracy (reward) is to match your partner’s mean confidence. The structure of the task differed between the behavioural and fMRI sessions as explained in the main text.


