. 2020 Jul 23;9:e56477. doi: 10.7554/eLife.56477

Figure 3. Encoding of motion coherence and social context in lateral frontal pole.

(A) Regions of interest (ROIs). (B) We modelled neural responses to the context screen, including both linear and quadratic terms for coherence and context as parametric modulators – with the quadratic context term indexing the need for a context-dependent private-public mapping. (C) ROI contrast estimates for coherence (K), quadratic coherence (K2), context (C) and quadratic context (C2). We tested significance (asterisk) by comparing contrast estimates across subjects to zero (p<0.05, one-sample t-test). Statistical results are summarised in Table 1. Data are represented as group mean ± SEM. (D) Visualisation of whole-brain activation for quadratic context in lateral prefrontal cortex (clusters significant at p<0.05, FWE-corrected for multiple comparisons, with a cluster-defining threshold of p<0.001, uncorrected). See Appendix 1 for whole-brain activations in response to context screen and Appendix 2 for whole-brain activations in response to presentation of the motion stimulus. dACC: dorsal anterior cingulate cortex. pgACC: perigenual anterior cingulate cortex. FPl: lateral frontal pole.

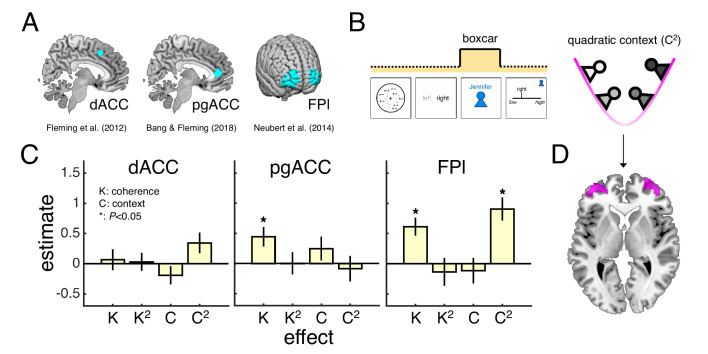
Figure 3.

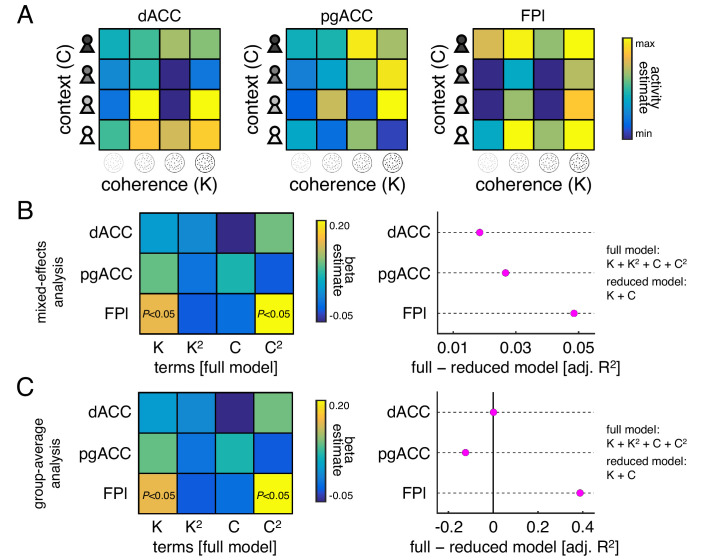
Figure 3—figure supplement 1. Evaluation of quadratic terms.

Figure 3—figure supplement 1.

The analysis of ROI responses to the context screen shown in Figure 3C was based on a model (GLM1) that included linear and quadratic terms for coherence (K) and context (C) as parametric modulators. Both the linear and the quadratic terms were derived from our factorial design and theoretically motivated. Nevertheless, we ran an independent set of analyses to validate the inclusion of the quadratic terms in our model. To this end, we extracted ROI activity estimates under GLM3 – originally estimated for RSA – which modelled neural responses to the context screen separately for each condition of our factorial design (4 × 4 = 16). We applied a full model (linear and quadratic) and a reduced model (only linear) to these activity estimates within a regression framework and compared their goodness-of-fit (here defined as adjusted R2 which controls for the number of model predictors). This approach revealed that the goodness-of-fit was higher for the full than the reduced model in FPl and that this difference was higher for FPl than the other ROIs. (A) Heat map visualising mean ROI activity estimates for each condition of our factorial design under GLM3 (activity estimates were z-scored for each subject before averaging across subjects). (B) Mixed-effects analysis of ROI activity estimates. Plots show (left) fixed effects under full model and (right) difference in adjusted R2 between full and reduced model under a linear mixed-effects regression model (both fixed and random effects for each subject). (C) Group-average analysis of ROI activity estimates. Plots show (left) fixed effects under full model and (right) difference in adjusted R2 between full and reduced model under a linear regression analysis of the mean ROI activity estimates shown in panel A.