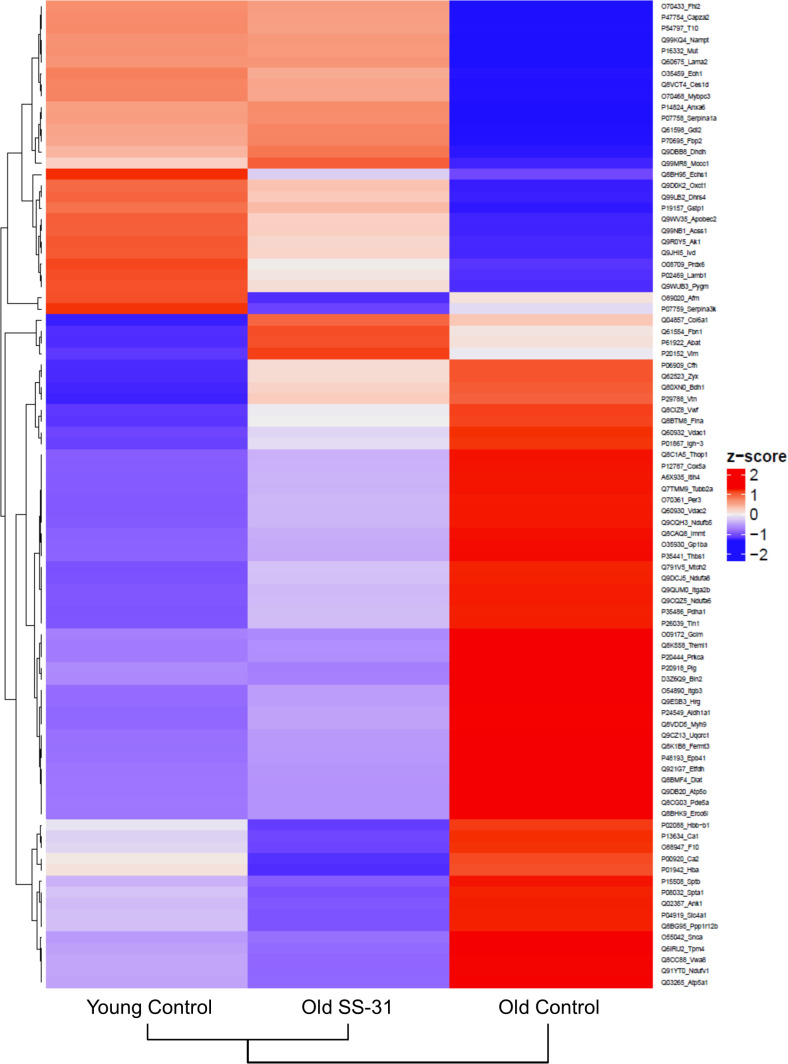
Figure 5. SS-31 treatment partially restores age-related proteomic remodeling.
A heatmap of z-scores the 88 proteins that were significantly altered by both aging (q < 0.05 for old control vs. young control) and SS-31 treatment (q < 0.05 for old SS-31 vs. old control); n = 9, 10, and eight male mice for young control, old control and old SS-31, respectively, analyzed as described in the method section. We computed the z-scores of the average log2 abundance values for each of the three groups, where we adjusted the data, by protein, to have a mean of zero and a standard deviation of 1. The heatmap was generated using the ComplexHeatmap (v.1.20.0) R package (Gu et al., 2016), where both the sample groups and the proteins were clustered via the hclust function with the ‘complete’ agglomeration method. Distance matrix for clustering were computed using ‘Euclidean’ distance. The resulting heatmap presents the proteins in rows and sample groups in columns, both of which were grouped according to the clustering results. Row labels on the right are the UniProt ID_Gene Name of each protein. The identities and fold changes of all protein identified are listed in Supplementary file 3.


