. 2020 Jul 23;9:e53476. doi: 10.7554/eLife.53476

Figure 4. Advantageous mutations arise from an interplay of increased enzymatic velocity and increased abundance in the absence of Lon.

(A) DHFR structure with mutational hot-spots. For positions with two or more top 100 advantageous mutations in the absence of Lon, the beta carbon is depicted as a sphere scaled according to the number of top mutations. For mutants selected for in vitro characterization, the beta carbon is colored according to its location in the DHFR structure: core (purple), surface beta-sheet (gold), proximal to the adenine ring on NADPH (blue), or proximal to the active site and M20 loop (red). Positions for advantageous mutants from the calibration set are depicted in dark grey. (B) The structure from A) rotated 90° clockwise. (C) In vitro velocities of purified DHFR wild-type and point mutants measured at 20 µM DHF. Bars are colored in reference to the hot-spots in A). Error bars represent ±1 standard deviation from three independent experiments (Materials and methods). The dashed line represents the velocity of WT DHFR. (D) DHFR cellular abundance calculated from the lysate DHFR activity in Figure 4—figure supplement 2 and in vitro kinetics with purified enzyme (see Materials and methods). Error bars represent the cumulative percent error (standard deviation) from three independent experiments for velocity and three biological replicates for lysate activity. Data are shown in both the -Lon (light grey) and +Lon (green) conditions. The dashed line represents the WT expression level of DHFR in the –Lon background. Mutants are in the same order as in C) (see Figure 4—source data 2; four mutants were not measured). (E) Cellular abundance of DHFR vs. in vitro velocities of purified DHFR wild-type and point mutants measured at 20 µM DHF. Points are colored as in A). Error bars represent ±1 standard deviation from three independent experiments (Materials and methods). The dashed line represents WT-level DHFR activity, i.e. DHFR abundance/velocity pairs whose product is equivalent to [DHFR]WT • velocityWT. (F) Correlation between in vitro Tm values and in vivo ∆selection coefficients for DHFR wild-type and characterized mutants. Points are colored as in A). (G) ∆Tm values and ∆∆selection coefficient for mutations at the same position. Points representing comparison between mutants are numbered as follows: 1) D116I-M, 2) M42Y-F, 3) W30M-F, 4) I91G-A, 5) Q102W-L, 6) L62A-V, 7) I41A-V, 8) W47V-L.

Figure 4—source data 1. In vitro velocity for selected advantageous measured as described in Materials and methods at multiple concentrations of DHF are reported with the standard deviation over three independent experiments.
Figure 4—source data 2. Soluble DHFR abundance levels in molecules per cell measured from lysate activity assays as described in Materials and methods.
All values are for the SMT205 plasmid transformed into the cell strain in the column heading. NM, not measured.
Figure 4—source data 3. Apparent Tm values from thermal denaturation experiments monitored by CD signal at 225 nm are reported along with the ∆selection coefficient (Lon impact) value depicted in Figure 4D.

Figure 4.

Figure 4—figure supplement 1. Structural context for hotspot residues from Figure 4.

Figure 4—figure supplement 1.

(A–D) For each panel, the hot spot region is indicated on a cartoon of DHFR: globular core in purple (A), the beta-sheet surface below the active site in gold (B), the base of the M20 loop in red (C) and the adenosine binding site in blue (D). Slices of the –Lon and +Lon heatmaps are shown for each position within the hot spot region (heatmap coloring is as in Figure 2). The wild-type residue is outlined in black. Positions 30, 47, 85, 102, 114, 116, 154 are in the Beneficial category. Position 24, 25, 62, 91, 92, 156 are in the Mixed category. Positions 41, 42, and 98 are in the Deleterious category. For A-C) the structure shown is PDBID: 3QL3, and for D) the structure shown is PDB ID: 1RX1. In IRX1 (as in 1RX4), R98 is in proximity to the adenine ring. In 3QL3, R98 extends into bulk solvent. Residues within the hot spot cluster are labeled with their residue number.Figure 4—figure supplement 2.

Figure 4—figure supplement 2. Lysate activity for DHFR wild-type and point mutants on the selection plasmid.

Figure 4—figure supplement 2.

(A) Lysate activity for DHFR variants under selection growth conditions (see Materials and methods) plotted as the rate of change in DHF concentration as a function of time monitored over the window of DHF concentration from 30 µM to 20 µM. DHFR activities in ER2566 ∆folA/∆thyA –Lon lysates are colored in grey. DHFR activities in ER2566 ∆folA/∆thyA +Lon lysates are colored in green. Error bars represent ±1 standard deviation from three biological replicates. (B) Relative lysate activities for DHFR variants. Lysate activities from A) normalized by WT-level of activity in the corresponding ±Lon cell lysate.

Figure 4—figure supplement 3. In vitro velocities of purified DHFR wild-type and point mutants.

Figure 4—figure supplement 3.

Velocities were measured at (A) 5, (B) 10, (C) 20, and (D) 30 µM DHF (Figure 4—source data 1). For each mutant, the bar is colored by the mutation’s location within the hot spots from Figure 4 and Figure 4—figure supplement 1. Error bars represent ±1 standard deviation from three independent experiments.

Figure 4—figure supplement 4. Soluble cellular abundance for DHFR wild-type and point mutants on the selection plasmid.

Figure 4—figure supplement 4.

Relative expression of DHFR variants. DHFR abundances from Figure 4D normalized by WT-level of abundance in the corresponding ±Lon cell lysate. Relative DHFR abundances in ER2566 ∆folA/∆thyA –Lon lysates are colored in grey. Relative DHFR abundances in ER2566 ∆folA/∆thyA +Lon lysates are colored in green. Error bars represent the cumulative percent error (standard deviation) from three independent experiments for velocity and three biological replicates for lysate activity.

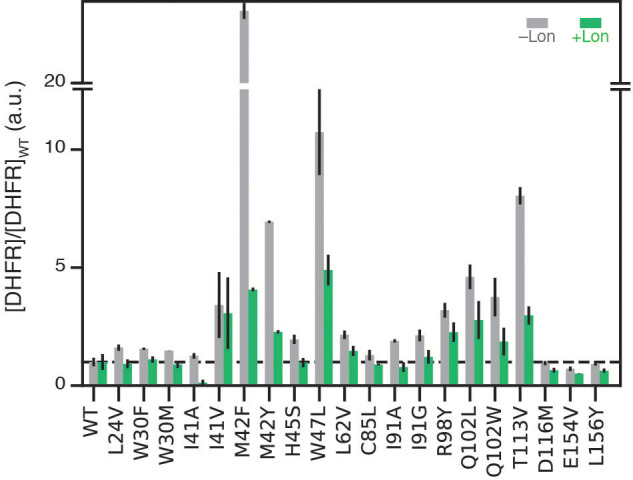
Figure 4—figure supplement 5. Lon impact as ∆selection coefficient versus change in DHFR abundance ±Lon.

Figure 4—figure supplement 5.

Correlation between the ratio of cellular DHFR abundance (Figure 4D, Figure 4—source data 2, [DHFR]+Lon/[DHFR]–Lon) and in vivo ∆selection coefficients ±Lon for DHFR wild-type and point mutants. Points are colored by the mutation’s location within the hot spots from Figure 4 and Figure 4—figure supplement 1. X-axis error bars represent the cumulative percent error (standard deviation) from three measurements of DHFR concentration with and without Lon (Materials and methods). Y-axis error bars the cumulative error (standard deviation) from three biological replicates for selection with and without Lon (Materials and methods). The ratio of expression for WT is not 1.0 because there is an increase in WT DHFR expression in ER2566 ∆folA/∆thy +Lon relative to WT expression in ER2566 ∆folA/∆thy –Lon (see Figure 1—figure supplement 2, Figure 1—source data 1). The reason for the unusual behavior of L24V (positive ∆selection coefficient), a mutation in the active site, is unknown.

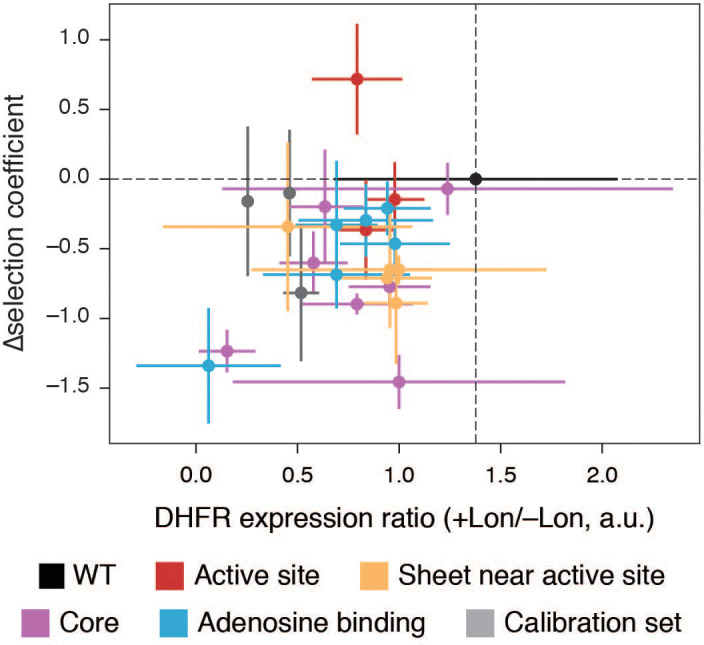
Figure 4—figure supplement 6. Cellular abundance versus in vitro velocity for DHFR wild-type and point mutants.

Figure 4—figure supplement 6.

Cellular abundance of DHFR vs. in vitro velocities of purified DHFR measured at (A) 5, (B) 10, (C) 20, and (D) 30 µM DHF (see Figure 4—figure supplement 3, Figure 4—source data 1, Figure 4D, Figure 4—source data 2). Points are colored by the mutation’s location within the hot spots from Figure 4 and Figure 4—figure supplement 1. Error bars represent ±1 standard deviation from three independent experiments (Materials and methods). The dashed line represents WT equivalent DHFR activity, where [DHFR]WT • velocityWT = [DHFR]mut • velocitymut.

Figure 4—figure supplement 7. Selection coefficient compared to predictions of DHFR wild-type and point mutant activity from cellular abundance and in vitro velocity measurements.

Figure 4—figure supplement 7.

Selection coefficients for –Lon selection (grey) and +Lon selection (green) plotted against DHFR activity calculated as cellular abundance of DHFR times in vitro velocities of purified DHFR variants ([DHFR] • velocity[DHF]) measured at (A) 5, (B) 10, (C) 20, and (D) 30 µM DHF (see Figure 4D, Figure 4—figure supplement 3, Figure 4—source data 1, Figure 4—source data 2). X-axis error bars represent the cumulative percent error (standard deviation) from three measurements of DHFR concentration with and without Lon and three independent experiments for velocity (Materials and methods). Y-axis error bars represent ±1 standard deviation from (Materials and methods).

Figure 4—figure supplement 8. Zoom in for Selection coefficient compared to predictions of DHFR wild-type and point mutant activity from cellular abundance and in vitro velocity measurements.

Figure 4—figure supplement 8.

Selection coefficients for –Lon selection (grey) and +Lon selection (green) plotted against DHFR activity calculated as cellular abundance of DHFR times in vitro velocities of purified DHFR variants ([DHFR] • velocity[DHF]) measured at (A) 5, (B) 10, (C) 20, and (D) 30 µM DHF (see Figure 4D, Figure 4—figure supplement 3, Figure 4—source data 1, Figure 4—source data 2). X-axis error bars represent the cumulative percent error (standard deviation) from three measurements of DHFR concentration with and without Lon and three independent experiments for velocity (Materials and methods).Y-axis error bars represent ±1 standard deviation from (Materials and methods).

Figure 4—figure supplement 9. Thermal denaturation curves monitored by CD signal at 225 m for selected hotspot mutants.

Figure 4—figure supplement 9.

The curves are colored by the mutation’s location within the hot spots from Figure 4 and Figure 4—figure supplement 1. The raw data are shown with thin lines and the fitted curves are shown as thick lines. For each plot, the mutant identity and apparent Tm value are listed in the top left corner.