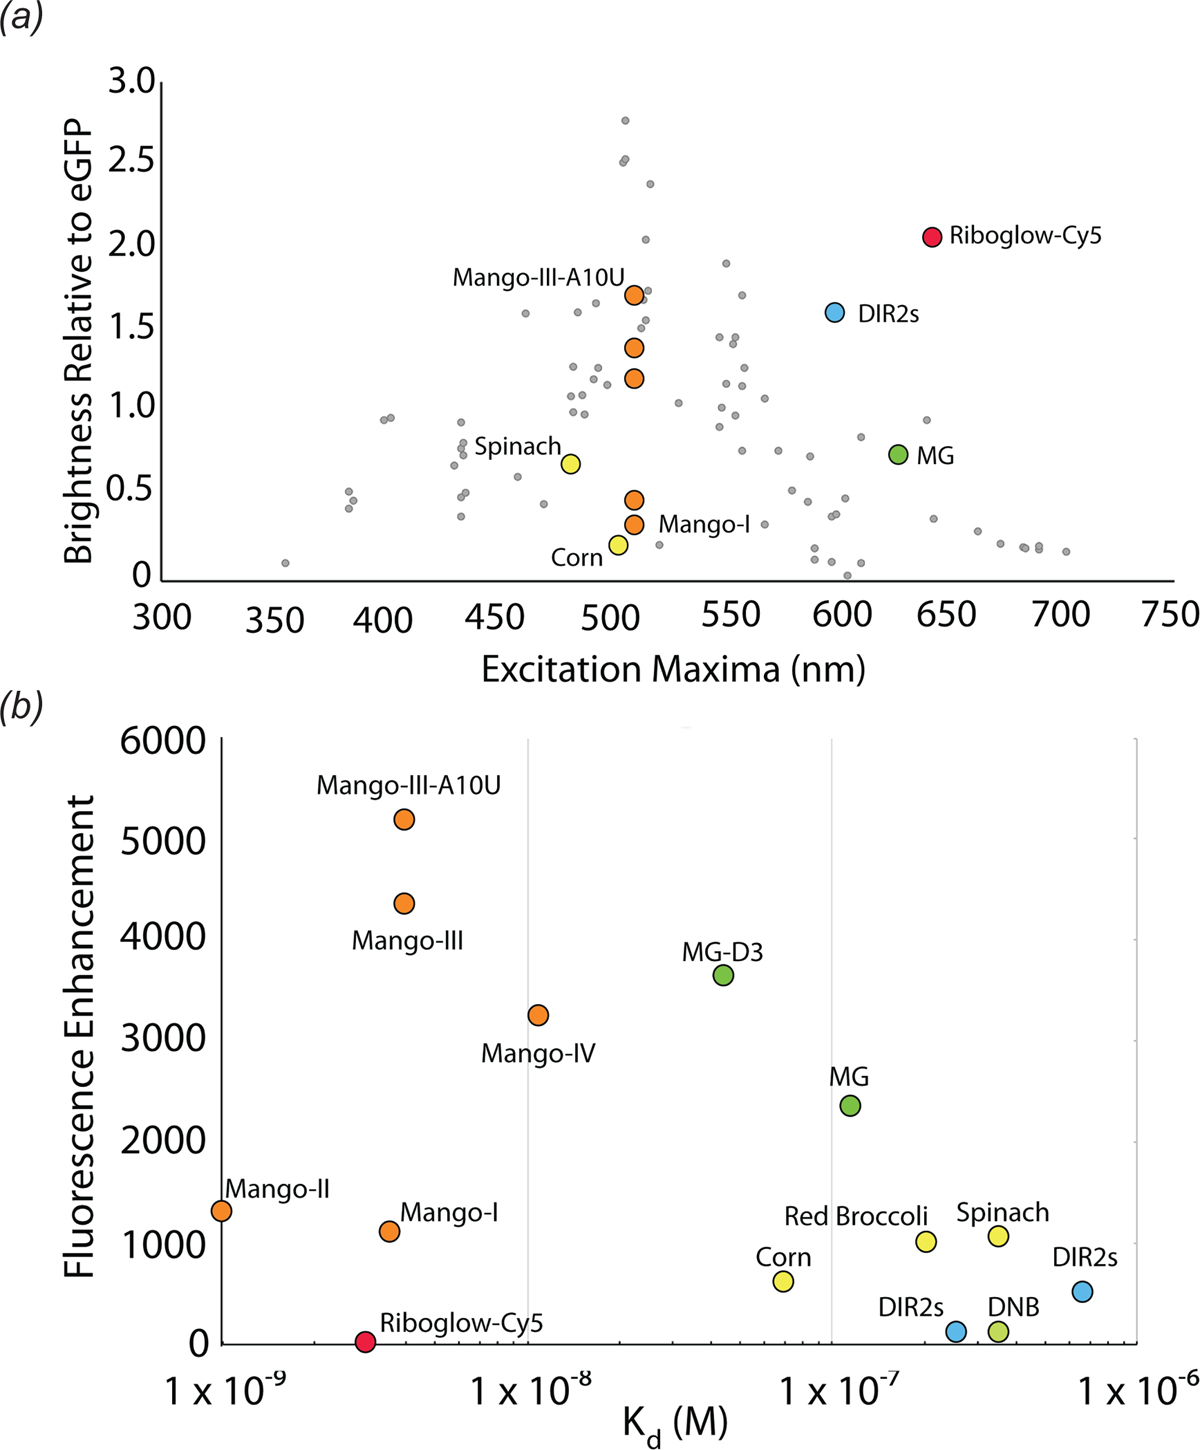
Fig. 2.

Photophysical comparison of fluorescent aptamers. (a) Excitation maxima and brightness relative to eGFP for select fluorescent aptamers. Aptamer complexes are colored according to sequence or fluorophore lineage (Fig. 1). DIR-2 (light blue), DNB (dark blue), Chili (purple), HBI derivatives (yellow), Riboglow (red), Malachite Green (green), Mango RNAs (orange). Grey points denote fluorescent proteins, adapted from Rodriquez et al. 2017 (b) Scatter plot of aptamer-fluorophore dissociation constants (Kd) and fluorescence enhancements (FE), depicting diverse fluorescence efficiencies (Kd * FE).
