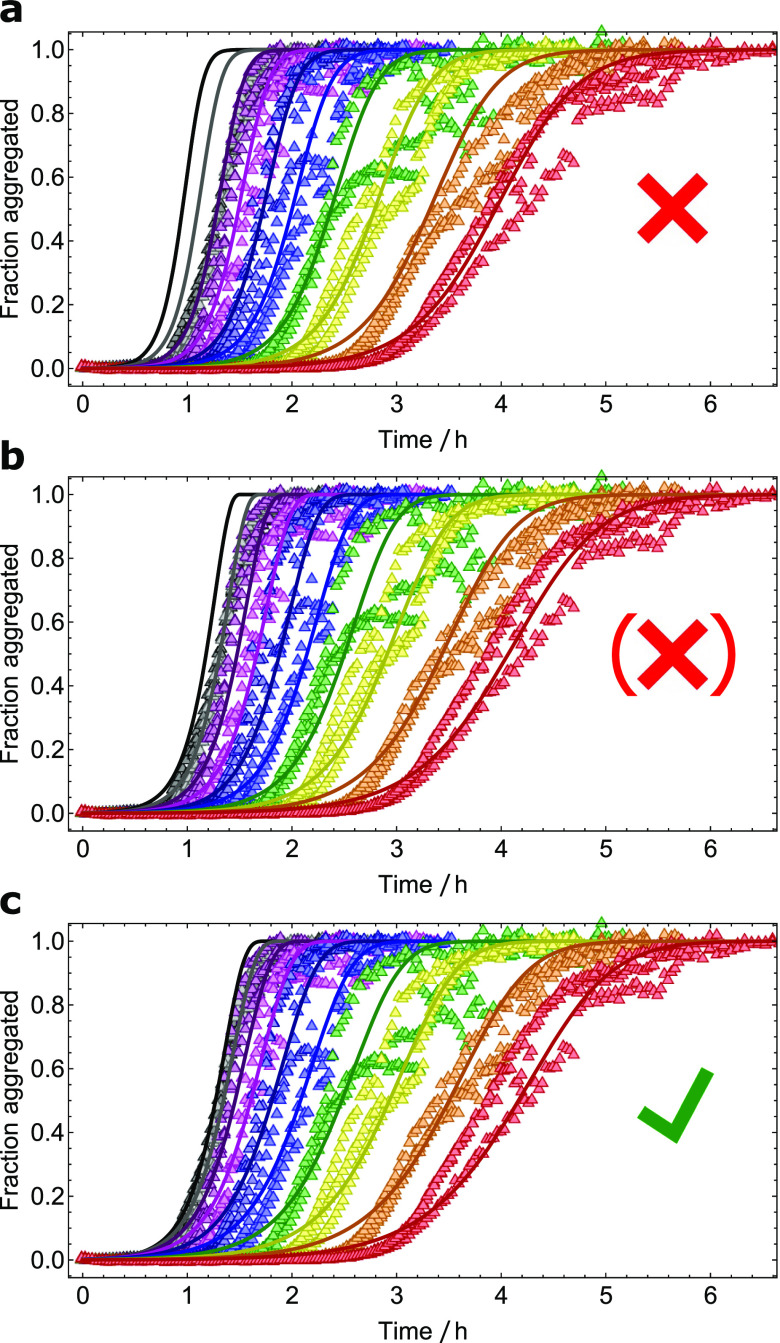
FIG. 3.
Aggregation of Aβ40 monomers into filaments; fractional aggregation monitored by ThT fluorescence vs time. Initial monomer concentrations ranging from 3.5 µM to 70 µM (only 9.1–70 µM shown here). Data taken from Ref. 10. (a) The fit to the model by Meisl et al.10 is only able to reproduce aggregation curves below 35 µM. (b) Equation (10a) with KP set to an arbitrarily large value fits the data significantly better, yielding KE = 103 µM. (c) When fully unconstrained, Eq. (10a) fits the data better still, yielding a larger value of KE and a moderate value of KP, suggesting that saturation in primary nucleation is more important than in elongation for this system. However, the improvement in fit quality is too small to reach a firm conclusion and more analysis is needed.

