FIG. 8.
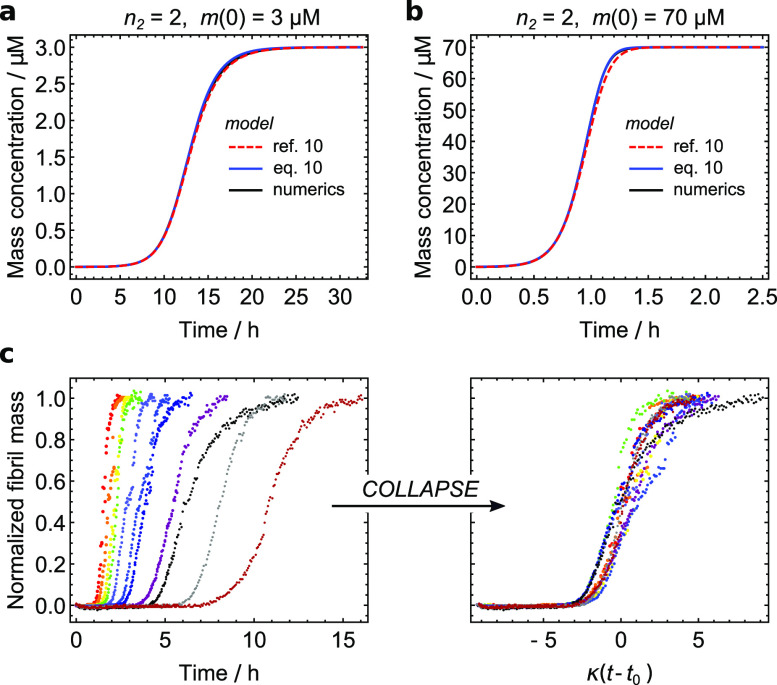
(a) and (b): using rate constants for Aβ40 aggregation taken from Ref. 10, we calculate kinetic curves for initial monomer concentrations of 3 µM (a) and 70 µM (b). The curve calculated according to the solution developed in this paper [blue, Eq. (10a)] matches the numerical solutions (black) almost precisely; even better than the already highly accurate analytical solution developed in Ref. 10 (red). (c) Raw Ab40 data from Ref. 10 at a range of concentrations 35–3.5 μM (d) Scaling by κ′, and addition of , effectively collapses the data onto a universal curve, since experimental errors in these data are a greater source of variation from universality than the small differences in for each individual curve.

