
Figure 2.
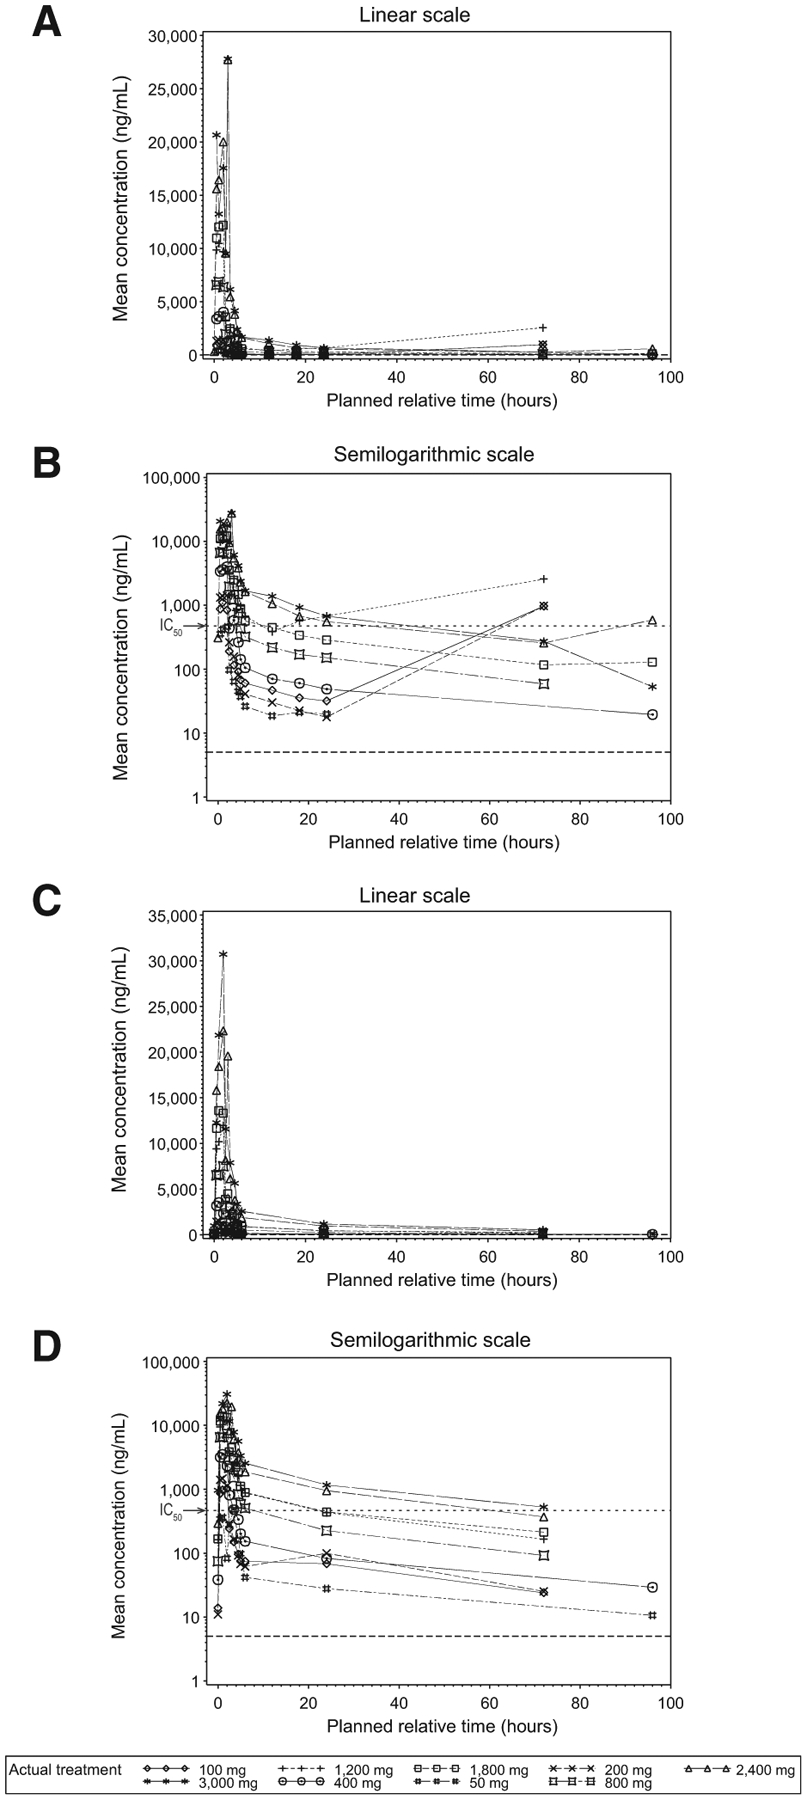
Mean plasma concentration-time plots (linear and semilogarithmic) for cycle 1, day 1 and day 15. Mean plasma GSK2816126 concentration–time plots are shown for cycle 1, day 1 visit (A and B) and cycle 1, day 15 visit (C and D) by nominal time on a linear scale (A and C) and a semilogarithmic scale (B and D). The dotted line in panels B and D represents the lower limit of quantitation (5 ng/mL). The protein-binding adjusted IC50 for H3K27me3 (475 ng/mL) is indicated by an arrow on B and D.