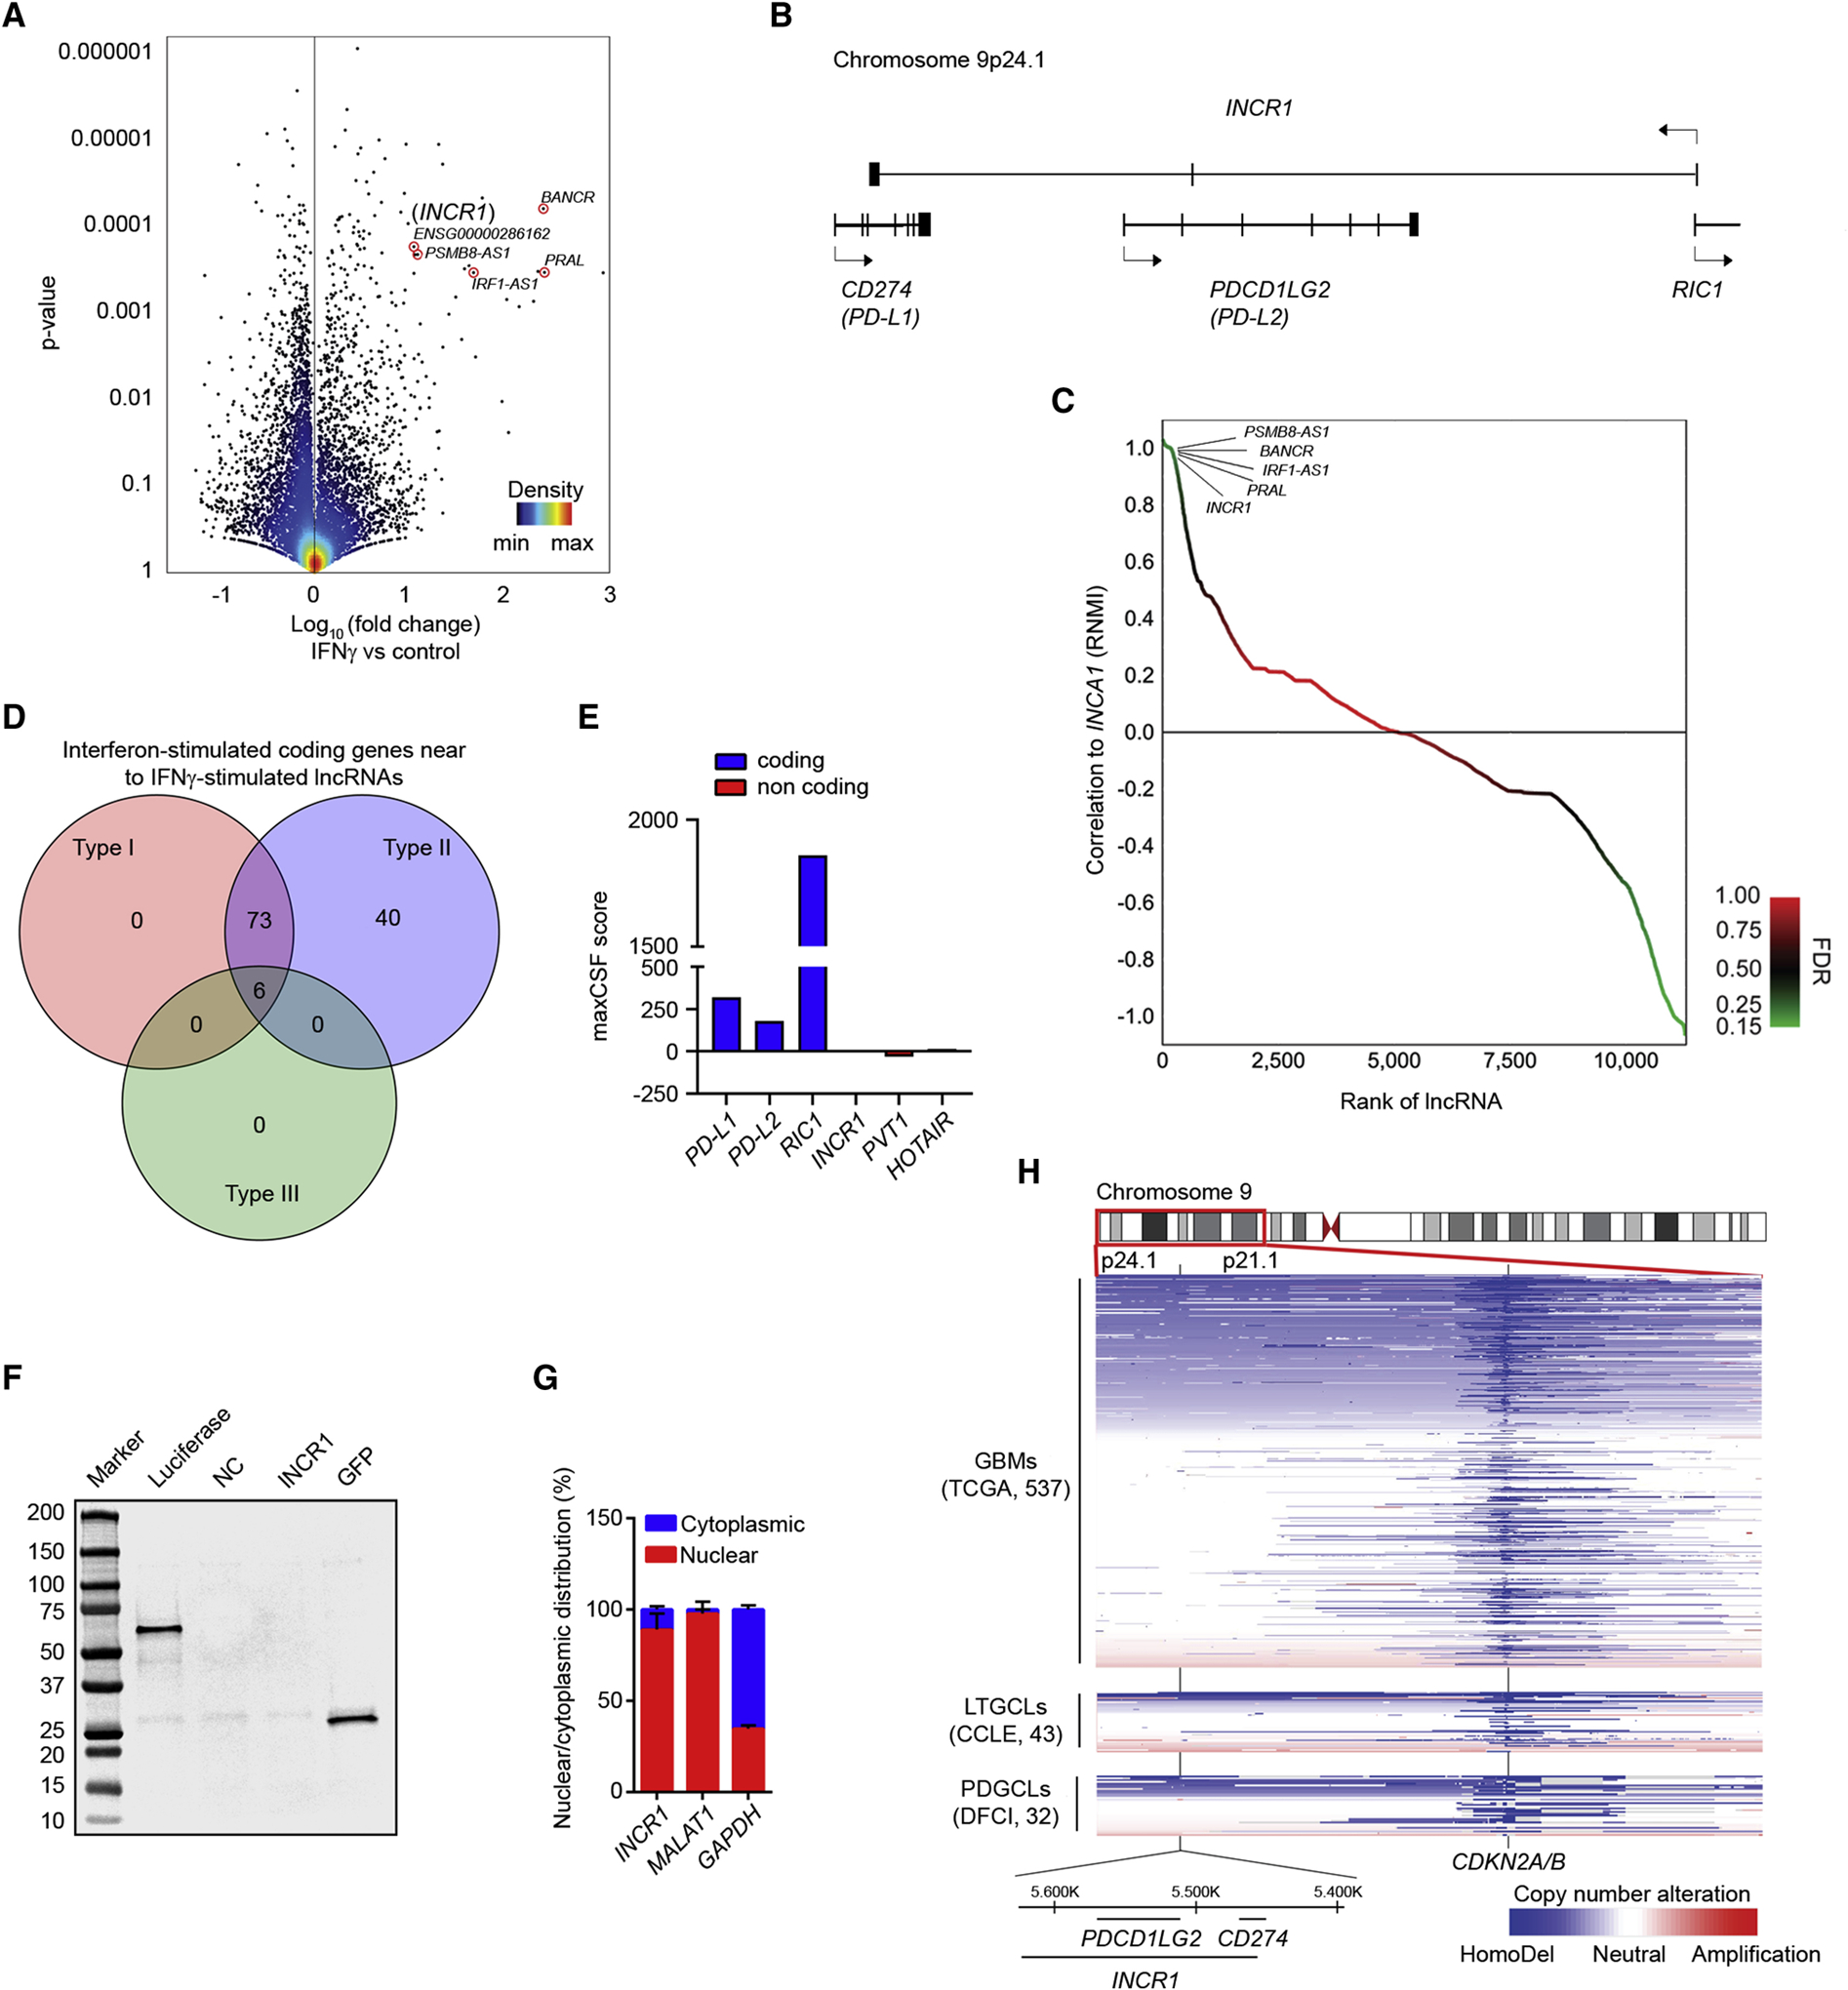
Figure 1. INCR1 is a lncRNA expressed in tumor cells exposed to IFNγ.

(A) Volcano plot of differentially expressed lncRNAs (RNA-seq) between unstimulated patient-derived GBM cell lines (PDGCLs) and PDGCLs stimulated with 100 U/ml IFNγ for 24 h (n=3 biological replicates). A set of the most up-regulated lncRNAs is annotated. 15,768 lncRNAs were surveyed in the analysis.
(B) Schematic representation of the INCR1 gene and the genes within the same locus but transcribed from the opposite strand.
(C) Approximately 237 lncRNAs were positively correlated and 1,188 negatively correlated (p-value <0.05, FDR<0.25, green color) with INCR1 expression. A set of the correlated lncRNAs is annotated.
(D) The Venn diagram shows the number of coding genes, transcribed from the same loci of lncRNAs correlated with INCR1, whose expression is regulated by one or more IFN types (Type I, II or III). Venn diagram was generated using the Interferome database (www.interferome.org).
(E) PhyloCSF analysis of the maximum CSF score of INCR1 and other known coding (blue) and non-coding (red) genes.
(F) INCR1 was in vitro transcribed and translated and reaction product was analyzed by Western blot (lane 4). Absence of protein product confirms INCR1 as a non-coding RNA. pSP64-Luciferase and pcDNA3.1-GFP vectors were used as positive control (lanes 2 and 5 respectively). No template reaction was used as negative control (NC, lane 3).
(G) qRT-PCR analysis of RNAs extracted from cytoplasmic and nuclear compartments of IFNγ-stimulated patient derived BT333 cells. MALAT1 and GAPDH were used to assess fractionation efficiency.
(H) Heat-map showing copy number losses (blue) and gains (red) in GBM tumors (n=573) and cell lines models (43 LTGCLs and 32 PDGCLs). Horizontal-axis represents genetic markers along cytobands 9p24.1 to 9p21.1 while vertical-axis includes specimens (rows) stratified by groups.
