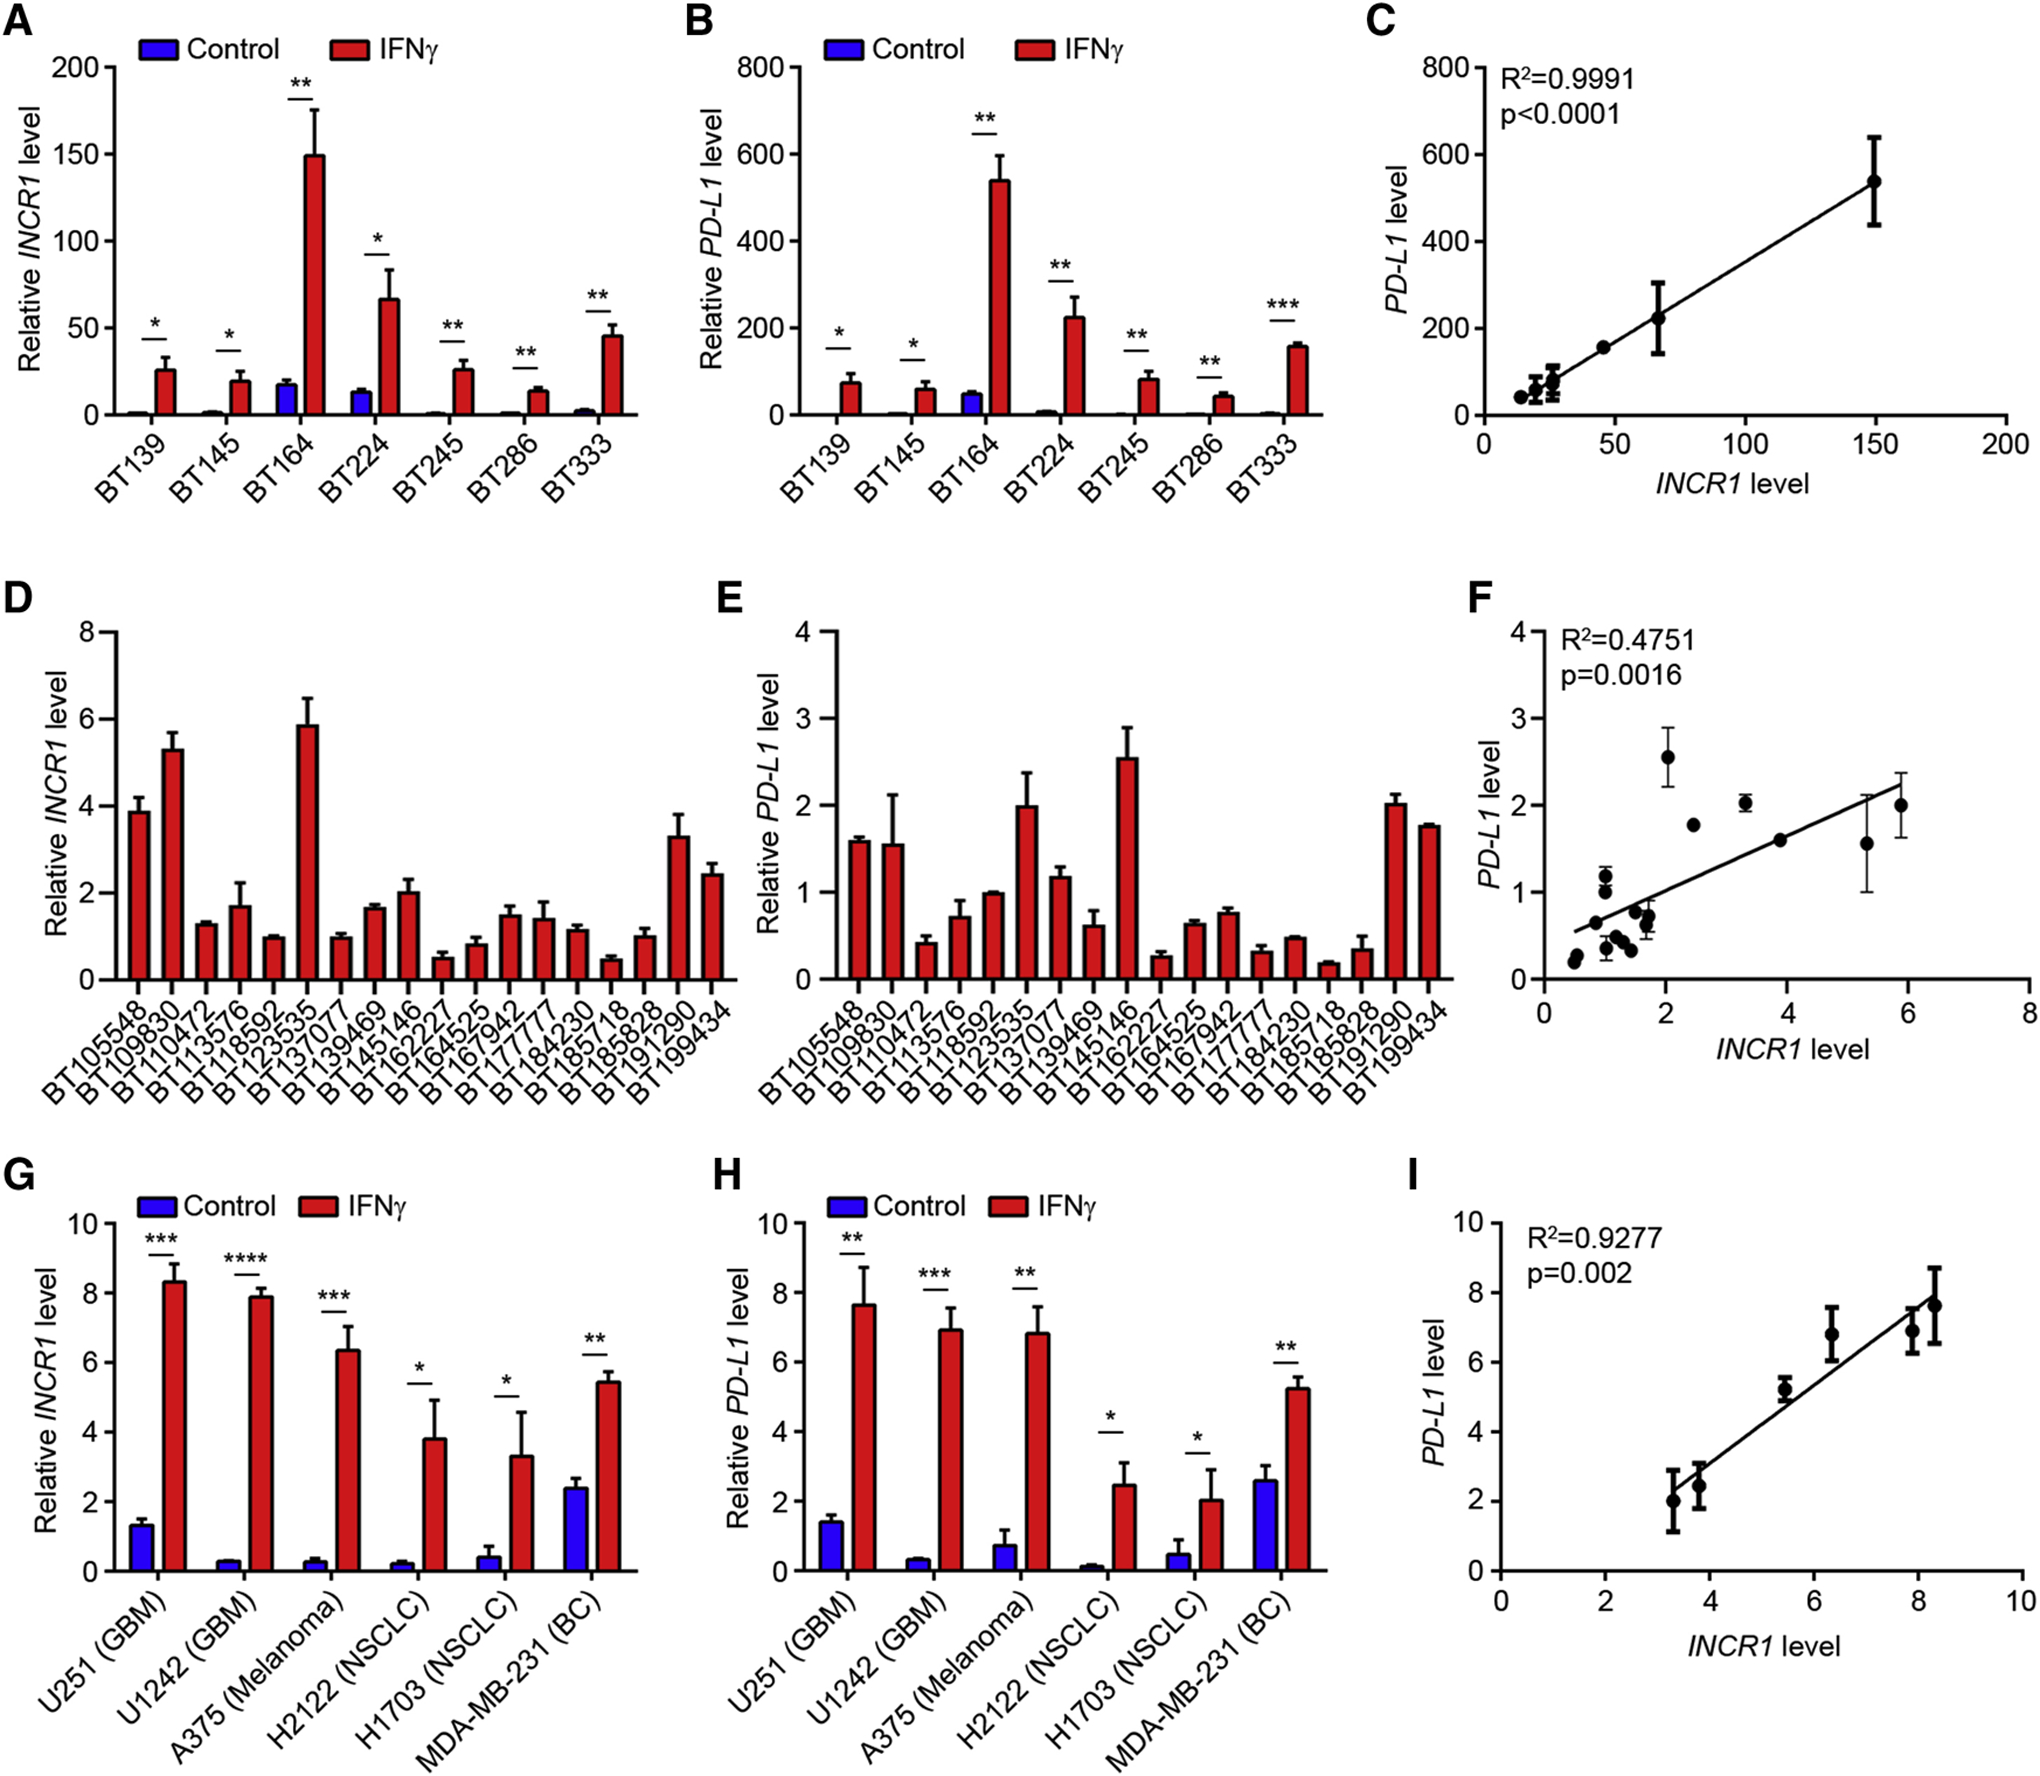
Figure 2. INCR1 expression correlates with PD-L1 levels in different cancer cells and patient tumors.

(A-C) qRT-PCR analysis of INCR1 (A) and PD-L1 (B) expression in 7 unstimulated or IFNγ-stimulated (100 U/ml for 24 h) PDGCLs, and correlation of INCR1 expression with PD-L1 expression in IFNγ-stimulated PDGCLs (C). R2=0.9991 calculated using linear regression analysis.
(D-F) Expression of INCR1 (D) and PD-L1 (E) in 18 GBM patient tumor specimens, and correlation of INCR1 expression with PD-L1 expression (F). R2=0.4751 calculated using linear regression analysis.
(G-I) qRT-PCR analysis of INCR1 (G) and PD-L1 (H) expression in 6 unstimulated or IFNγ-stimulated (100 U/ml for 24 h) long term cell lines from different tumor types and correlation of INCR1 expression with PD-L1 expression (I). Tumor cell types include glioblastoma (GBM), melanoma, non-small cell lung cancer (NSCLC) and breast cancer (BC). R2=0.9277 calculated using linear regression analysis.
Data shown as mean ± SD of three biological replicates (A, B, C, G, H and I) and as mean ± SD of three technical replicates (D, E and F). Data were analyzed by unpaired t-test: *p < 0.05, **p < 0.01, ***p < 0.001, ****p < 0.0001.
