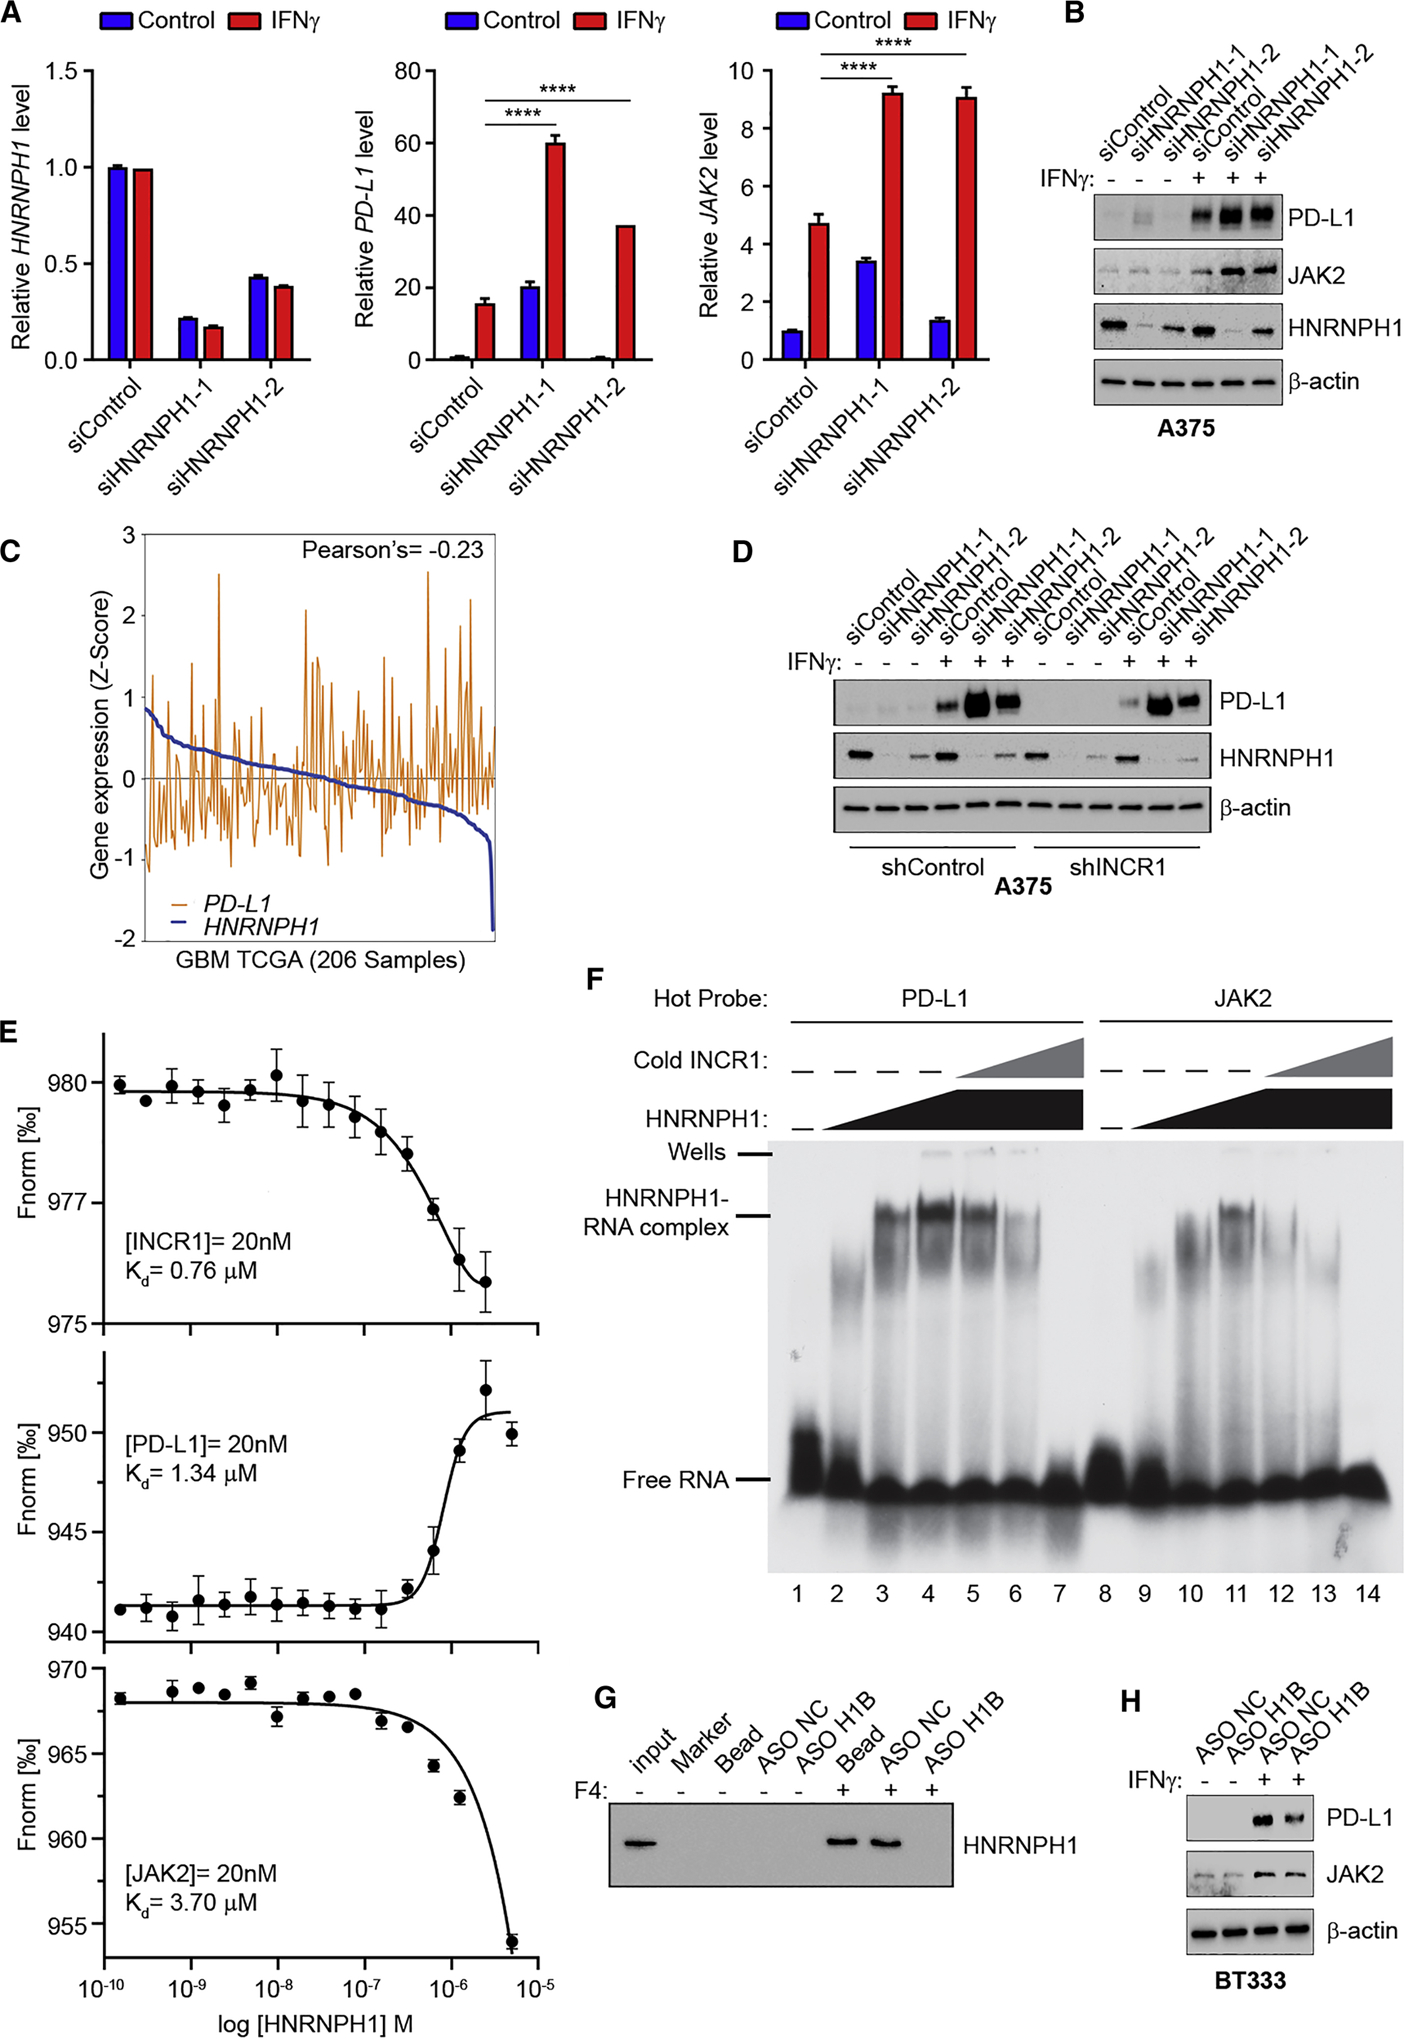
Figure 6. INCR1 functions as a negative regulator of HNRNPH1 activity.

(A) qRT-PCR analysis of HNRNPH1 (left), PD-L1 (center) and JAK2 (right) expression in unstimulated or IFNγ-stimulated (100 U/ml for 24 h) A375 cells transfected with siRNA control or two different siRNAs targeting HNRNPH1.
(B) Western blot analysis of PD-L1, JAK2 and HNRNPH1 expression in control or two independent HNRNPH1-knockdown A375 cells unstimulated or stimulated with 100 U/ml IFNγ for 24 h.
(C) Correlation of HNRNPH1 expression with PD-L1 expression in GBM tumors (n=206).
(D) Control and INCR1-knockdown (shINCR1–2) A375 cells were transfected with siRNA control or two independent siRNAs targeting HNRNPH1. Cells were stimulated with 100 U/ml IFNγ for 24 h and expression of HNRNPH1 and PD-L1 was analyzed by Western blot.
(E) Binding curves of HNRNPH1 interaction with a 50 nucleotide RNA oligonucleotide whose sequence represents the major eCLIP peak of INCR1 (top), PD-L1 (middle) and JAK2 (bottom), demonstrating a specific binding of HNRNPH1 with a Kd of 0.76 μM, 1.34 μM and 3.7 μM respectively.
(F) EMSA analysis of the effect of INCR1 RNA fragment on HNRNPH1 ability to bind to radiolabeled PD-L1 (left) or JAK2 (right) RNA fragments (50 nM). No protein was added to the lane 1 and 8. HNRNPH1 was added at the concentration of 0.65 μM (lane 2 and 9), 3.25 μM (lane 3 and 10) and 6.5 μM (lanes 4–7 and 11–14). INCR1 was added at molar ratio of 1:1 (lane 5 and 12), 1:5 (lane 6 and 13) and 1:10 (lane 7 and 14).
(G) RNA pull-down assay with biotinylated INCR1 fragment 4 (F4) in the presence of antisense oligonucleotide control (ASO NC) or targeting HNRNPH1 binding site (ASO H1B).
(H) Western blot analysis of PD-L1 and JAK2 expression in ASO NC or ASO H1B transfected patient derived BT333 cells unstimulated or stimulated with 100 U/ml IFNγ for 24 h.
Data are representative of three (A, F, G) or two (B, D, H) independent experiments. Data shown as mean ± SD of at least three replicates. Data were analyzed by unpaired t-test: ****p < 0.0001.
