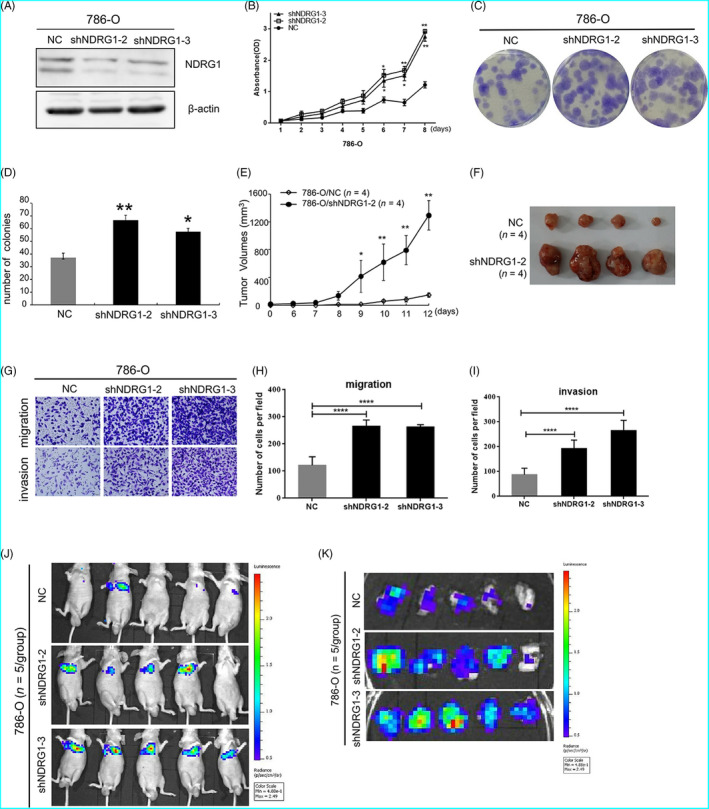
FIGURE 5.

NDRG1 suppressed the proliferation and metastasis of ccRCC tumour cells. (A) Western blot for 786‐O control and NDRG1 shRNA cell lines, β‐actin as loading control. NC: 786‐O control cells; (B) NDRG1 inhibited cell proliferation as shown by CCK‐8 assays. (C and D) Colony formation assay indicated that NDRG1 knockdown significantly increased the cloning number of 786‐O cells compared with control group. (C) Representative image of the colony formation assay. (D) was quantification of (C). (E)Tumour growth curve and the tumour volumes were measured at different days after injection 786‐O cells stably transfected with control or shNDRG1. (F) Mice were sacrificed, and the subcutaneous tumours were removed (n = 4 for each group). (G) Migration and invasion assay were conducted to detect the migratory and invasive ability of 786‐O control cells and shNDRG1 cells. Each representative image is shown. (H and I) Quantitative results are, respectively, illustrated for Transwell assay. (J) Representative images of mice in each group at 28 d after tail vein injections of 786O cells (control or shNDRG1‐2/3 infected, n = 5/group). (K) Representative images of pulmonary metastasis in each group at 28 days after tail vein injections. All data represented the mean ± SD from three independent experiments, *P < .05, **P < .01, ****P < .0001 for unpaired t test
