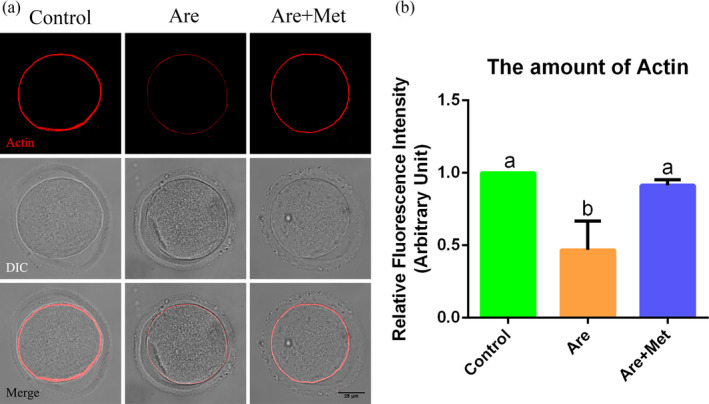
Figure 2.

Effects of metformin on the actin dynamics in the arecoline‐exposed oocytes. A, Representative pictures of actin filaments (Red) in the control, Are and Are + Met groups. Scale bar = 25 μm. B, The relative fluorescence intensity of F‐actin in the control, Are and Are + Met groups. DIC, differential interference contrast. Data were presented as mean ± SD. a‐bMeans not sharing a common superscript are different (P < .05)
