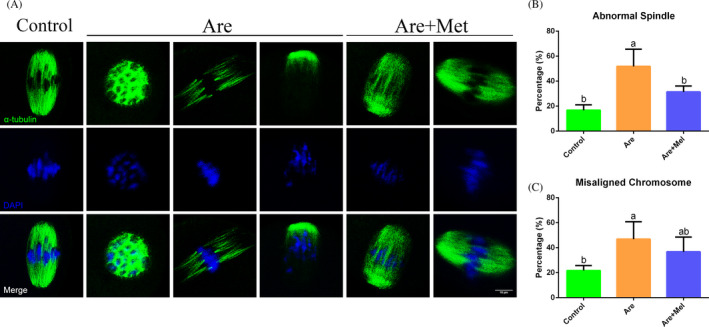
Figure 3.

Effects of metformin on the spindle assembly and chromosome alignment in the arecoline‐exposed oocytes. A, Representative pictures of spindle morphologies and chromosome alignment in the control, Are and Are + Met groups. Spindle (green) and chromosome (blue). Scale bar = 10 μm. B, The rates of aberrant spindles in the control, Are and Are + Met groups. C, The rates of misaligned chromosomes in the control, Are and Are + Met groups. Data were presented as mean ± SD. a‐bMeans not sharing a common superscript are different (P < .05)
