Figure 6.

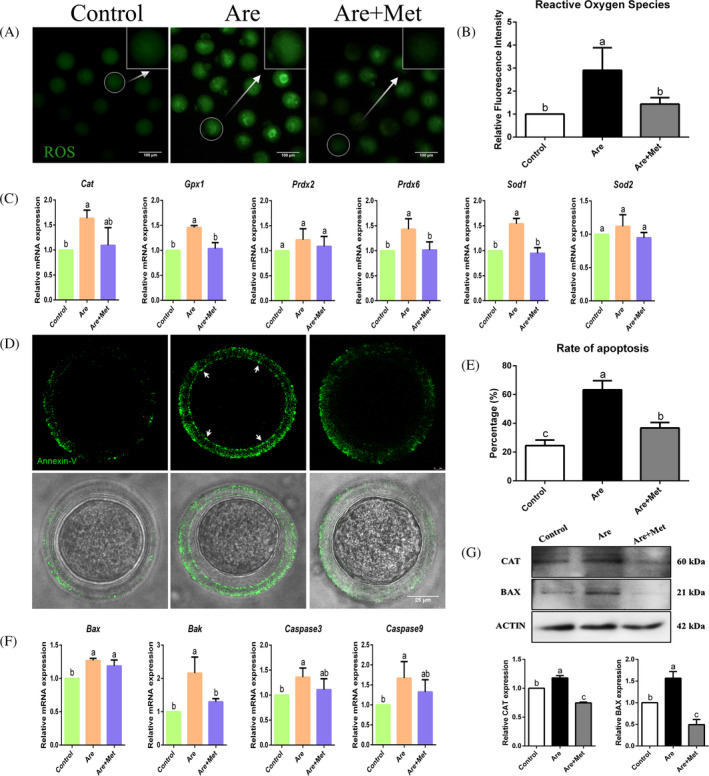
Effects of metformin on oxidative stress and early apoptosis in the arecoline‐exposed oocytes. A, Representative photographs of ROS levels (green) in the control, Are and Are + Met groups. Scale bar = 100 μm. B, Relative fluorescence intensity of ROS in the control, Are and Are + Met groups. C, Relative expression of oxidative stress‐related genes, including Cat, Gpx1, Prdx2, Prdx6, Sod2 and Sod1. D, Representative photographs of early apoptotic oocytes in the control, Are and Are + Met groups. Oocytes with fluorescence signals (green) at both membrane (white arrow) and zona pellucida are regarded as early‐stage apoptosis. Scale bar = 25 μm. E, The rate of early apoptosis oocytes in the control, Are and Are + Met groups. F, Relative expression of apoptosis‐related genes, including Bax, Bak, Caspase3 and Caspase9. (g) Relative level of oxidative stress and apoptosis‐related proteins, including CAT and BAX. Data were presented as mean ± SD. a‐cMeans not sharing a common superscript are different (P < .05)
