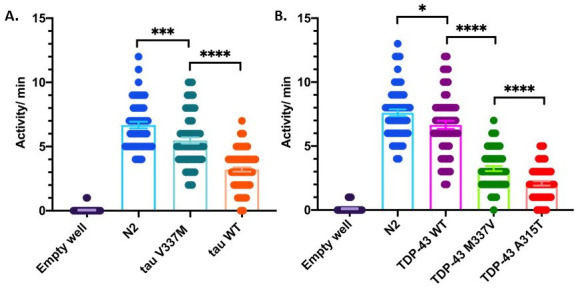
Figure 1. Activity differences of day 1 adult neurodegenerative disease model C. elegans measured by changes in LED microbeam disruption.

(A) Expression of mutant (tau V337M, strain CK10) or wild-type (tau WT, strain CK144) human tau pan-neuronally causes significant activity differences compared to N2. tau V337M and tau WT are also significantly different from each other. Graph displays aggregate population activity per minute. ***p=0.0005, ****p<0.0001, one-way ANOVA with Tukey’s multiple comparison’s test. Data from 3 independent replicate experiments, N=30 worms per replicate. (B) Expression of wild-type (TDP-43 WT, strain CK410) or mutant (TDP-43 M337V, strain CK423 and TDP-43 A315T, strain CK426) human TDP-43 pan-neuronally causes significant activity differences compared to N2. Each TDP-43 strain was also significantly different from each other. Graph displays aggregate population activity per minute. *p=0.02, ****p<0.0001, one-way ANOVA with Tukey’s multiple comparison’s test. Data from 4 independent replicate experiments, N=30 worms per replicate.
