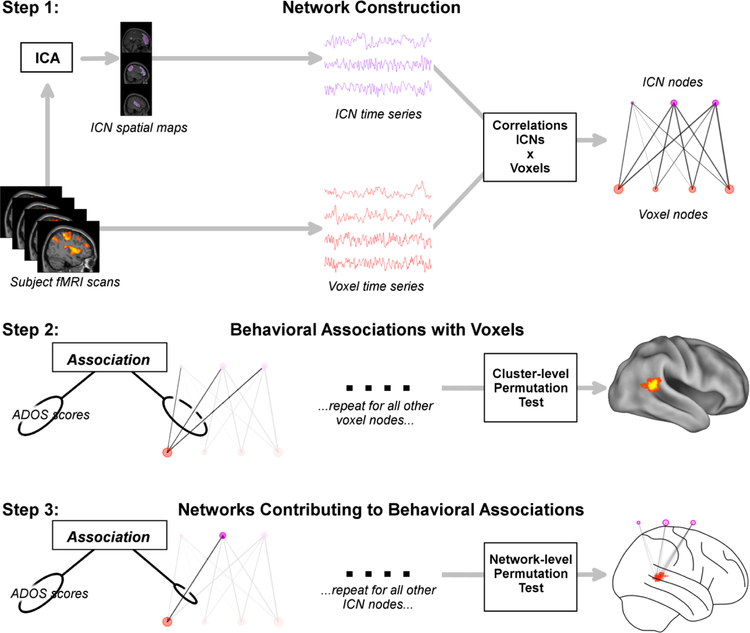
Figure 1.
Multi-level analysis steps. Step 1: Network construction. Following preprocessing, large-scale intrinsic connectivity networks (ICNs) were estimated using independent components analysis (ICA), resulting in a set of time series for each network. Each network’s time series was then correlated with every voxel’s time series, resulting in a bipartite network with voxel and ICN nodes (red and purple circles, respectively) efficiently summarizing and classifying all connectivity within the brain. Step 2: Behavioral associations with voxels. Each voxel’s connectivity vector (all connections to a single red circle) was associated with Autism Diagnostic Observation Schedule (ADOS) scores using multivariate distance covariance (dCov). Statistical inference was carried out using a cluster-level permutation test. Resulting whole-brain spatial maps show where in the brain connectivity is associated with ADOS scores. Step 3: Networks Contributing to Behavioral Associations. Connectivity between each ICN and every significant voxel in the previous step was tested for associations with ADOS scores using dCov. Statistical inference was carried out using a network-level permutation test. Resulting bipartite graphs demonstrated which specific ICNs influence ADOS scores in each region.

