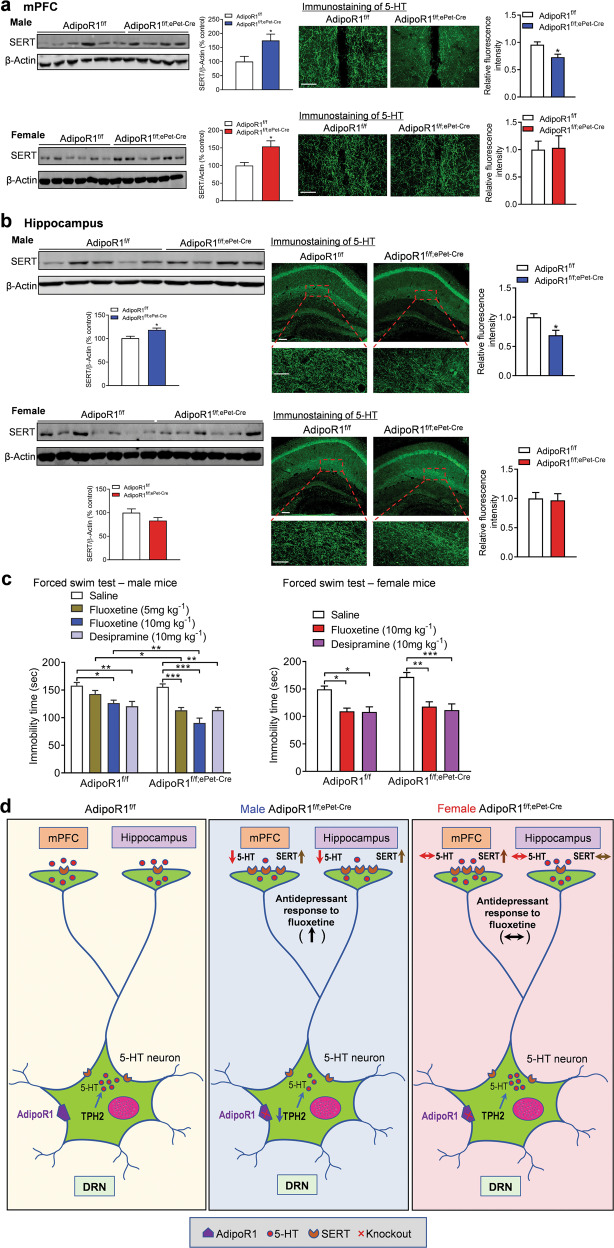
Fig. 5. Effects of selective deletion of AdipoR1 in 5-HT neurons on SERT and 5-HT immunoreactivity in mPFC and hippocampus and behavioral responses to fluoxetine and desipramine.
a (Left panels) Representative immunoblots and quantitative analysis of SERT levels in the mPFC of male (upper) and female (lower) mice. Male mice: AdipoR1f/f, n = 6; AdipoR1f/f;ePet-Cre, n = 6. Female mice: AdipoR1f/f, n = 7. AdipoR1f/f;ePet-Cre, n = 7. (Right panels) Representative brain sections immunostained for 5-HT and quantitative analysis of the intensity of 5-HT-positive fibers in the mPFC of male (upper) and female (lower) mice. Male: 14 sections from three AdipoR1f/f mice; 14 sections from three AdipoR1f/f;ePet-Cre mice. Female: 14 sections from three AdipoR1f/f mice; 13 sections from three AdipoR1f/f;ePet-Cre mice. Scale bar = 50 µm. b (Left panels) Representative immunoblots and quantitative analysis of SERT levels in the hippocampus of male (upper) and female (lower) mice. Male mice: AdipoR1f/f, n = 6; AdipoR1f/f;ePet-Cre, n = 6. Female mice: AdipoR1f/f, n = 7. AdipoR1f/f;ePet-Cre, n = 7. (Right panels) Representative brain sections immunostained for 5-HT and quantitative analysis of the intensity of 5-HT-positive fibers in the hippocampus of both male (upper) and female (lower) mice. Male: 24 sections from three AdipoR1f/f mice; 23 sections from three AdipoR1f/f;ePet-Cre mice. Female: 21 sections from three AdipoR1f/f mice; 24 sections from three AdipoR1f/f;ePet-Cre mice. Scale bar = 100 µm for low magnification and 50 µm for high magnification. c Forced swim test performed 30 min after fluoxetine (5 or 10 mg kg−1, i.p.) or desipramine (10 mg kg−1, i.p.) injection in male (left) and female (right) mice. Male mice: AdipoR1f/f + saline, n = 7; AdipoR1f/f + fluoxetine (5 mg kg−1), n = 9; AdipoR1f/f + fluoxetine (10 mg kg−1), n = 7; AdipoR1f/f + desipramine, n = 9; AdipoR1f/f;ePet-Cre + saline, n = 7; AdipoR1f/f;ePet-Cre + fluoxetine (5 mg kg−1), n = 9; AdipoR1f/f;ePet-Cre + fluoxetine (10 mg kg−1), n = 8; AdipoR1f/f;ePet-Cre + desipramine, n = 7. Female mice: AdipoR1f/f + saline, n = 8; AdipoR1f/f + fluoxetine, n = 7; AdipoR1f/f + desipramine, n = 10; AdipoR1f/f;ePet-Cre + saline, n = 7; AdipoR1f/f;ePet-Cre + fluoxetine, n = 7; AdipoR1f/f;ePet-Cre + desipramine, n = 10. *P < 0.05, **P < 0.01, ***P < 0.001 compared with AdipoR1f/f littermate controls or saline-treated groups. d Schematic diagram illustrating the alterations in 5-HT system components and antidepressant responses induced by the loss of AdipoR1 in 5-HT neurons.

