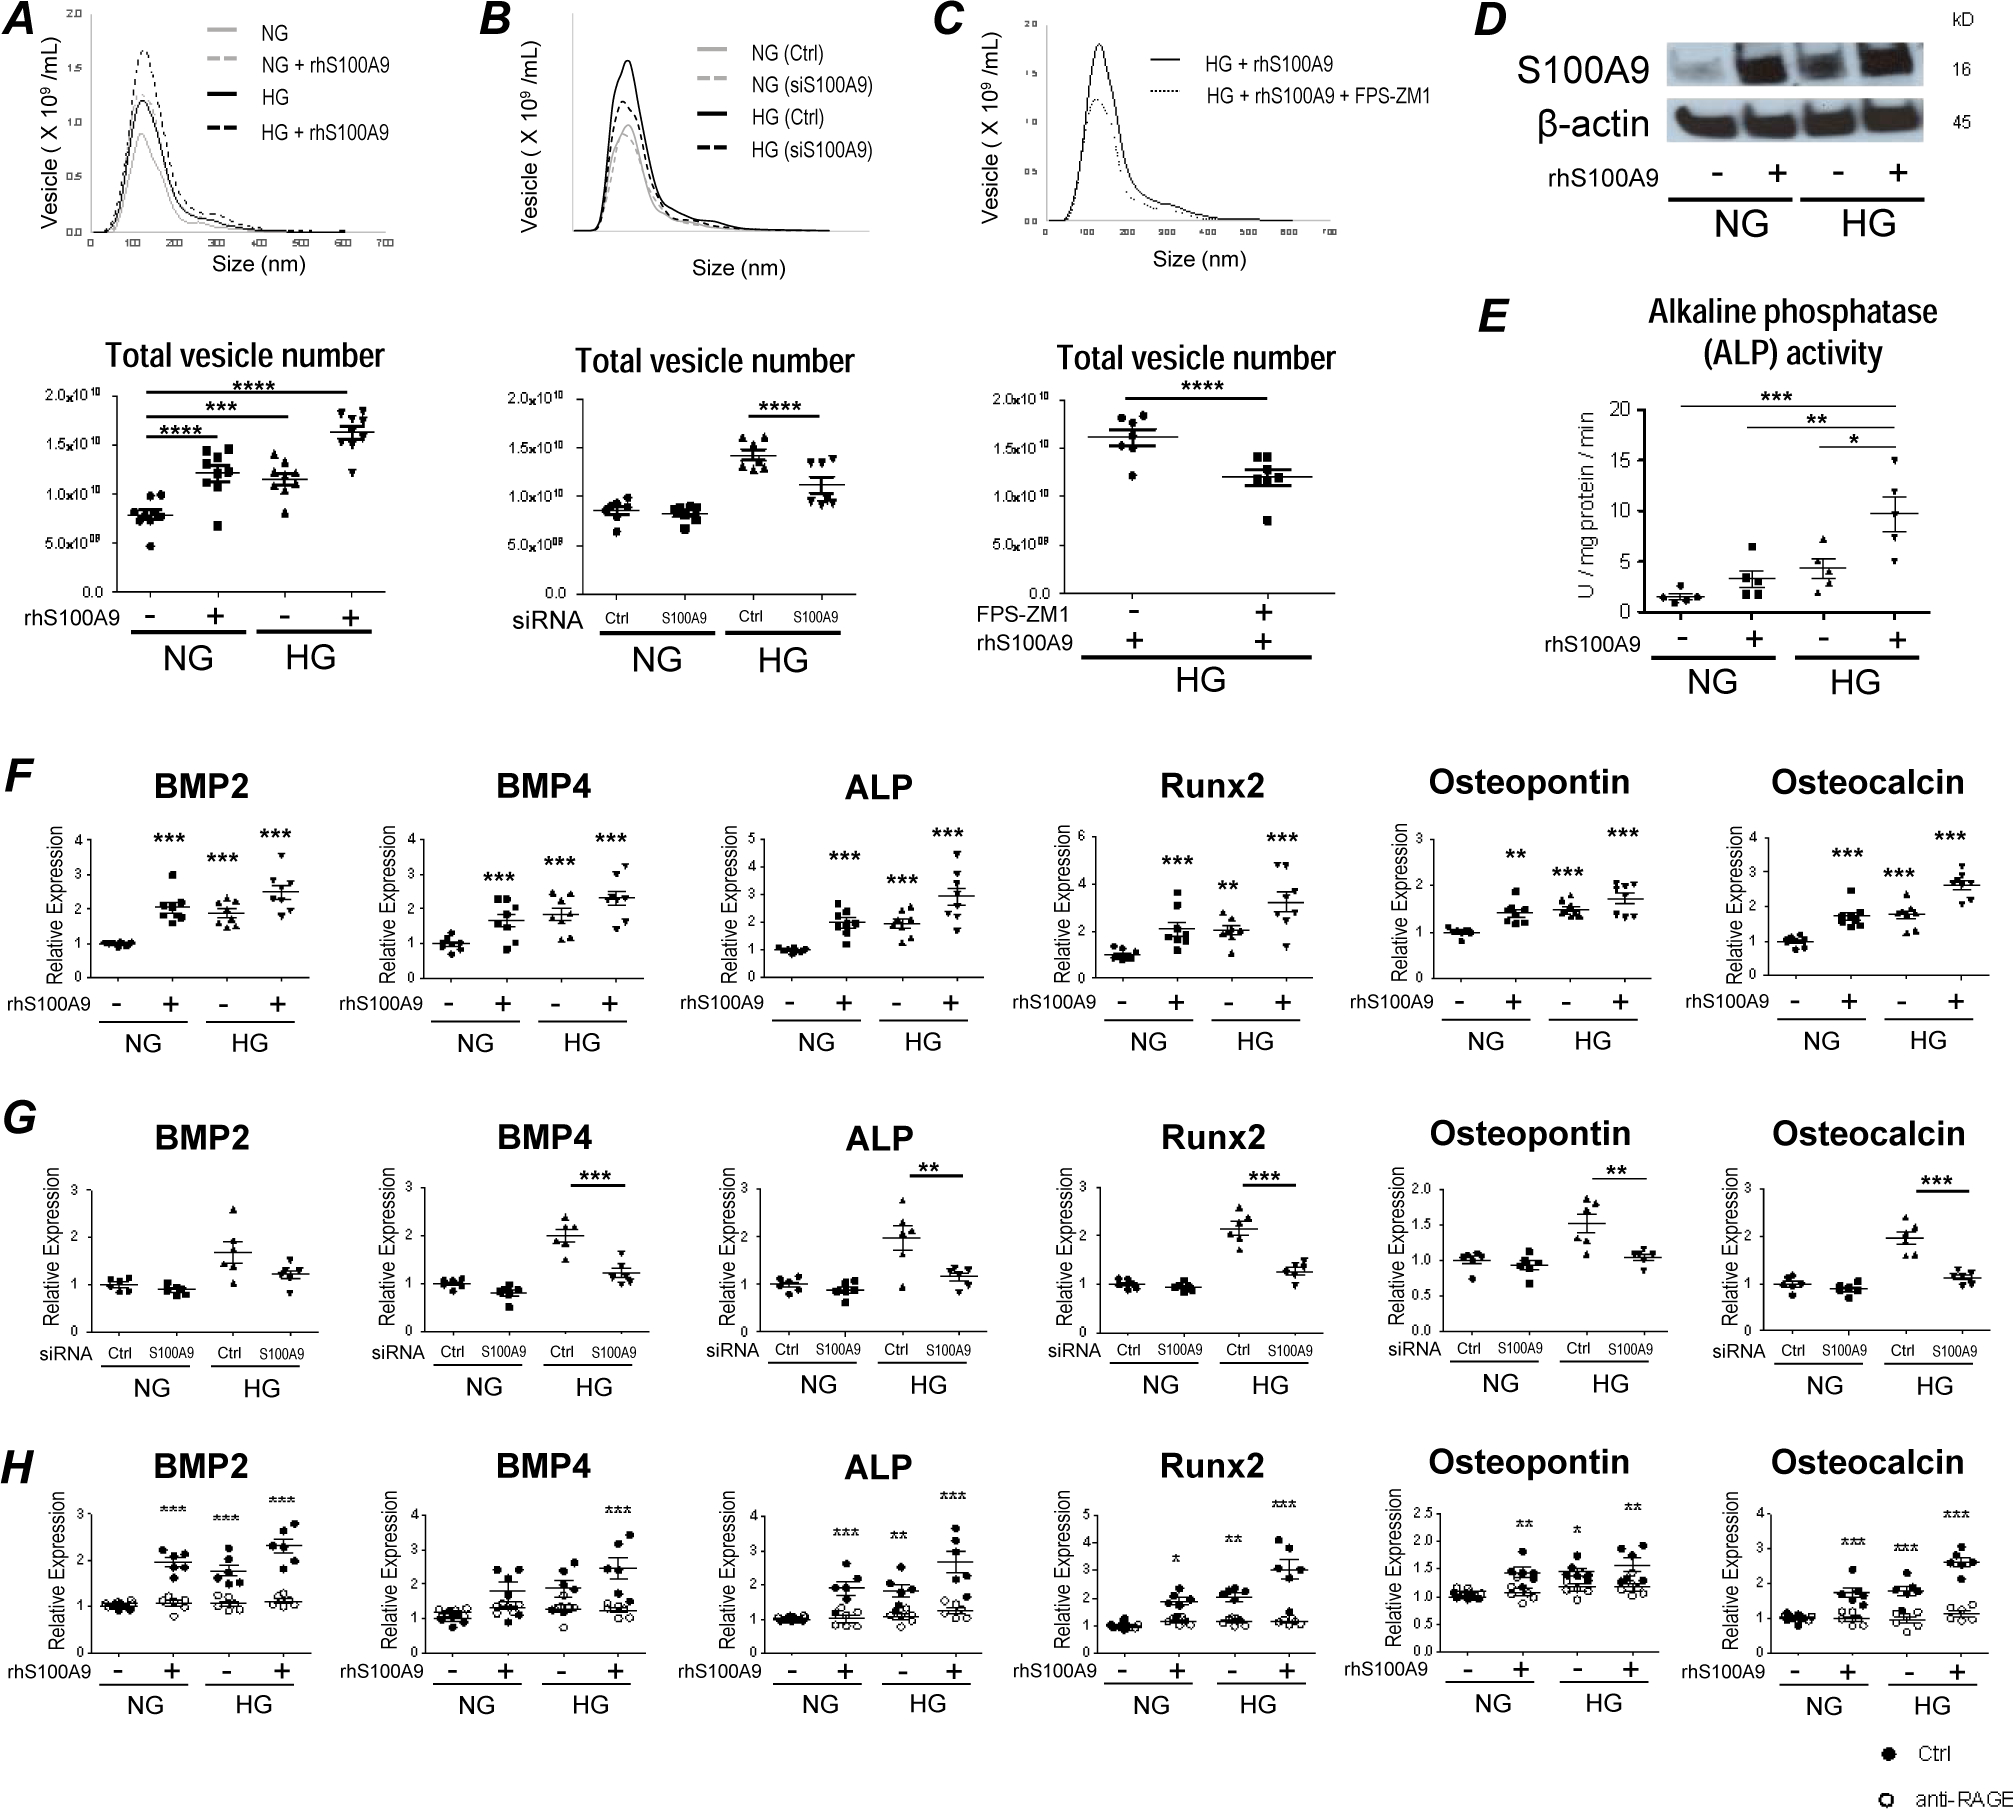
Figure 2. S100A9 regulates secretion and calcific potential of extracellular vesicle (EV) from human primary macrophages.

(A) Size distribution and quantification of EVs derived from human primary macrophages were measured after stimulation with HG and rhS100A9 for 24 hours by nanoparticle tracking analysis (n = 9 PBMC donors). (B) Size distribution and quantification of EVs derived from human primary macrophages were measured after suppression by S100A9 siRNA for 48 hours and administration with NG and HG for 24 hours (n = 7 PBMC donors). (C) Size distribution and quantification of EVs derived from human primary macrophages were measured after pretreatment with RAGE-antagonist (FPS-ZM1, 10 μg/mL) for 4 hours, and stimulation with HG and rhS100A9 for 24 hours (n = 7 PBMC donors). (D) The expression of S100A9 was measured within EVs derived from human primary macrophages by western blotting after stimulation with HG and rhS100A9 for 24 hours. These blots from one donor are representative of the 4 PBMC donors. (E) Calcific potential of EVs derived from human primary macrophages was measured by alkaline phosphatase (ALP) activity after stimulation with HG and rhS100A9 for 24 hours (n = 5 PBMC donors). (F) mRNA expression of the osteogenic factors, BMP2, BMP4, ALP, Runx2, osteopontin, and osteocalcin was measured in human primary macrophages after stimulation with HG and rhS100A9 for 12 hours (n = 8 PBMC donors). (G) mRNA expression of osteogenic factors was measured in human primary macrophages after suppression by S100A9 siRNA for 48 hours and administration with HG for 12 hours (n = 6 PBMC donors). (H) mRNA expression of osteogenic factors was measured in human primary macrophages after pretreatment with RAGE-antagonist (FPS-ZM1, 10 μg/mL) for 4 hours, and stimulation with HG and rhS100A9 for 12 hours (n = 6 PBMC donors). P value was calculated by unpaired student’s t-test or one-way ANOVA, based on a comparison with NG, or two-way ANOVA followed by Bonferroni test. *P < 0.05, **P < 0.01, ***P < 0.001, ****P < 0.0001. Error bars indicate ± SEM.
