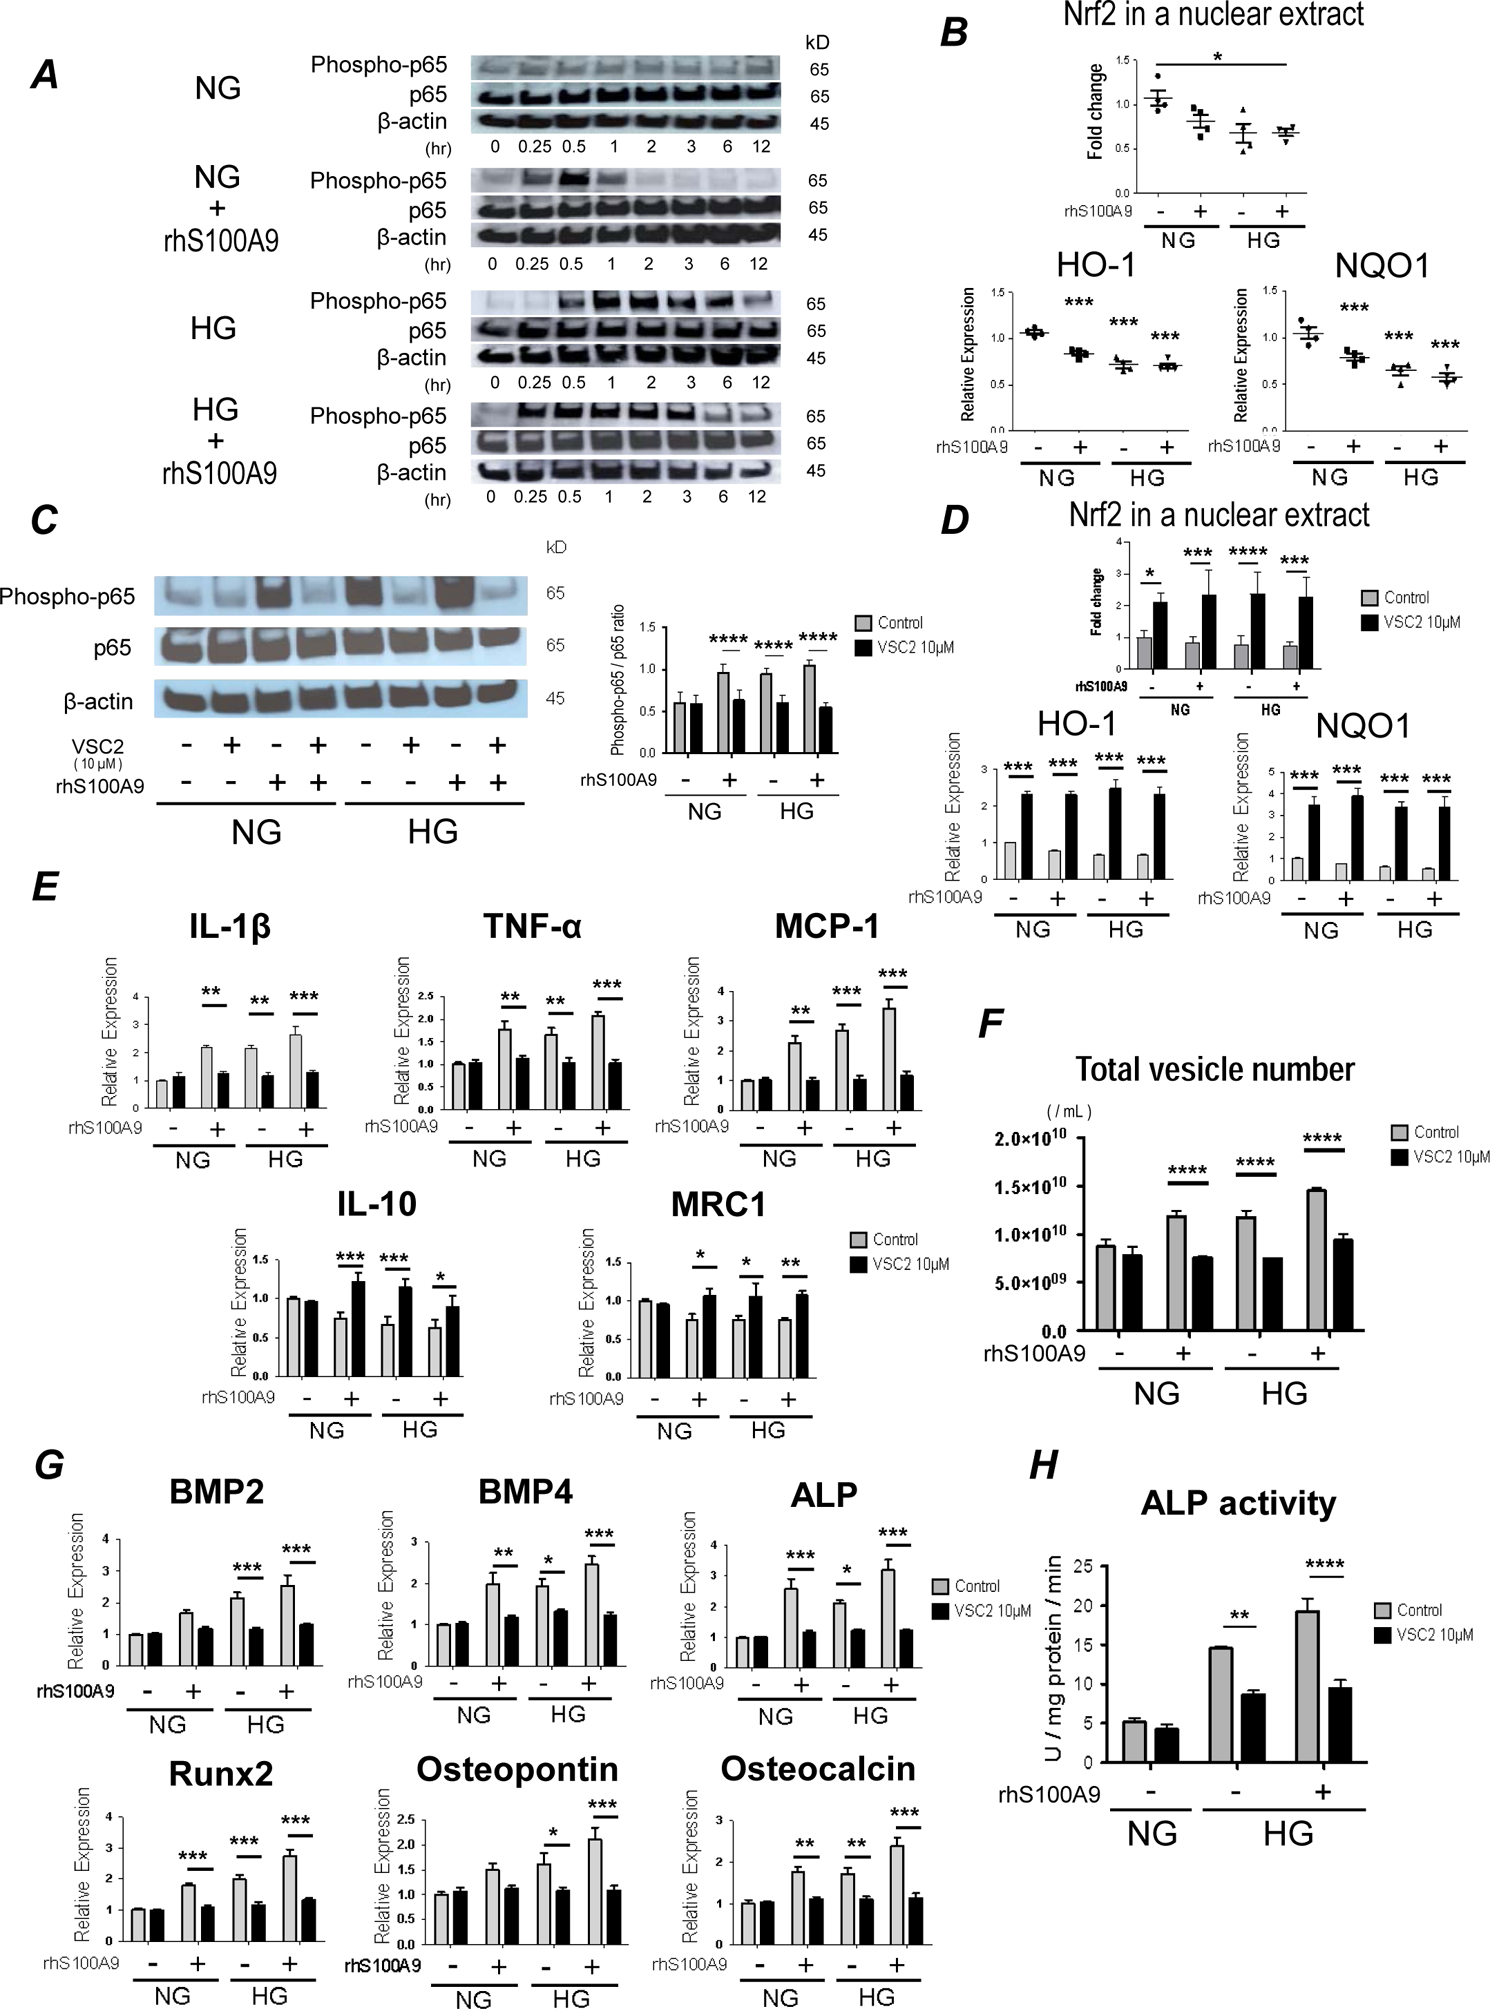
Figure 3. Imbalance of the Nrf2 and NF-κB pathways, induced by high glucose and S100A9, contribute to increased pro-inflammatory and osteogenic activity in human primary macrophages.

(A) THP-1 cells were cultured in either NG or HG, and then stimulated with rhS100A9 for the indicated times before being analyzed by Western blot with antibodies specific for the indicated targets. Data representative of the 3 different experiments. (B) Nrf2 in a nuclear extract of THP-1 cells (top panel, treated for 24 hours, 4 different experiments) was measured by Western blot and mRNA expression of detoxifying enzymes, hemeoxygenase-1 (HO-1) and NADPH quinone oxidoreductase 1 (Nqo1) (bottom panel, treated for 6 hours) were measured after stimulation with HG and rhS100A9 (n = 4 PBMC donors). (C) The expression of Ser536 phosphorylation of p65 was measured in human primary macrophages by Western blot after pretreatment with VSC2 (10 μM) for 1 hour and stimulation with HG and rhS100A9 for 24 hours. The graph shows the signal intensity of phosphorylated p-65 / p65 ratio (n = 4 PBMC donors). (D) Nrf2 in a nuclear extract of THP-1 cells (top panel, treated for 24 hours, 3 different experiments) was measured by Western blot and mRNA expression of HO-1 and Nqo1 (bottom panel, treated for 6 hours, n = 4 PBMC donors) was measured after pretreatment with VSC2 (10 μM) for 1 hour and stimulation with HG and rhS100A9. (E) mRNA expression of pro-inflammatory factors, IL-1β, TNF-α and MCP-1, and anti-inflammatory factors, IL-10 and MRC1 was measured in human primary macrophages after pretreatment with VSC2 (10 μM) for 1 hour, and stimulation with HG and rhS100A9 for 6 hours (n = 4 PBMC donors). (F) The number of EVs derived from human primary macrophages were measured after pretreatment with VSC2 (10 μM) for 1 hour, and stimulation with HG and rhS100A9 for 24 hours (n = 4 PBMC donors). (G) mRNA expression of osteogenic factors was measured in human primary macrophages after pretreatment with VSC2 (10 μM) for 1 hour, and stimulation with HG and rhS100A9 for 12 hours (n = 4 PBMC donors). (H) Calcific potential of EVs derived from THP-1 cells was measured by ALP activity after pretreatment with VSC2 (10 μM) for 1 hour, and stimulation with HG and rhS100A9 for 24 hours (3 different experiments). P value was calculated by one-way ANOVA, based on a comparison with NG, or two-way ANOVA followed by Bonferroni test. *P < 0.05, **P < 0.01, ***P < 0.001, ****P < 0.0001. Error bars indicate ± SEM.
