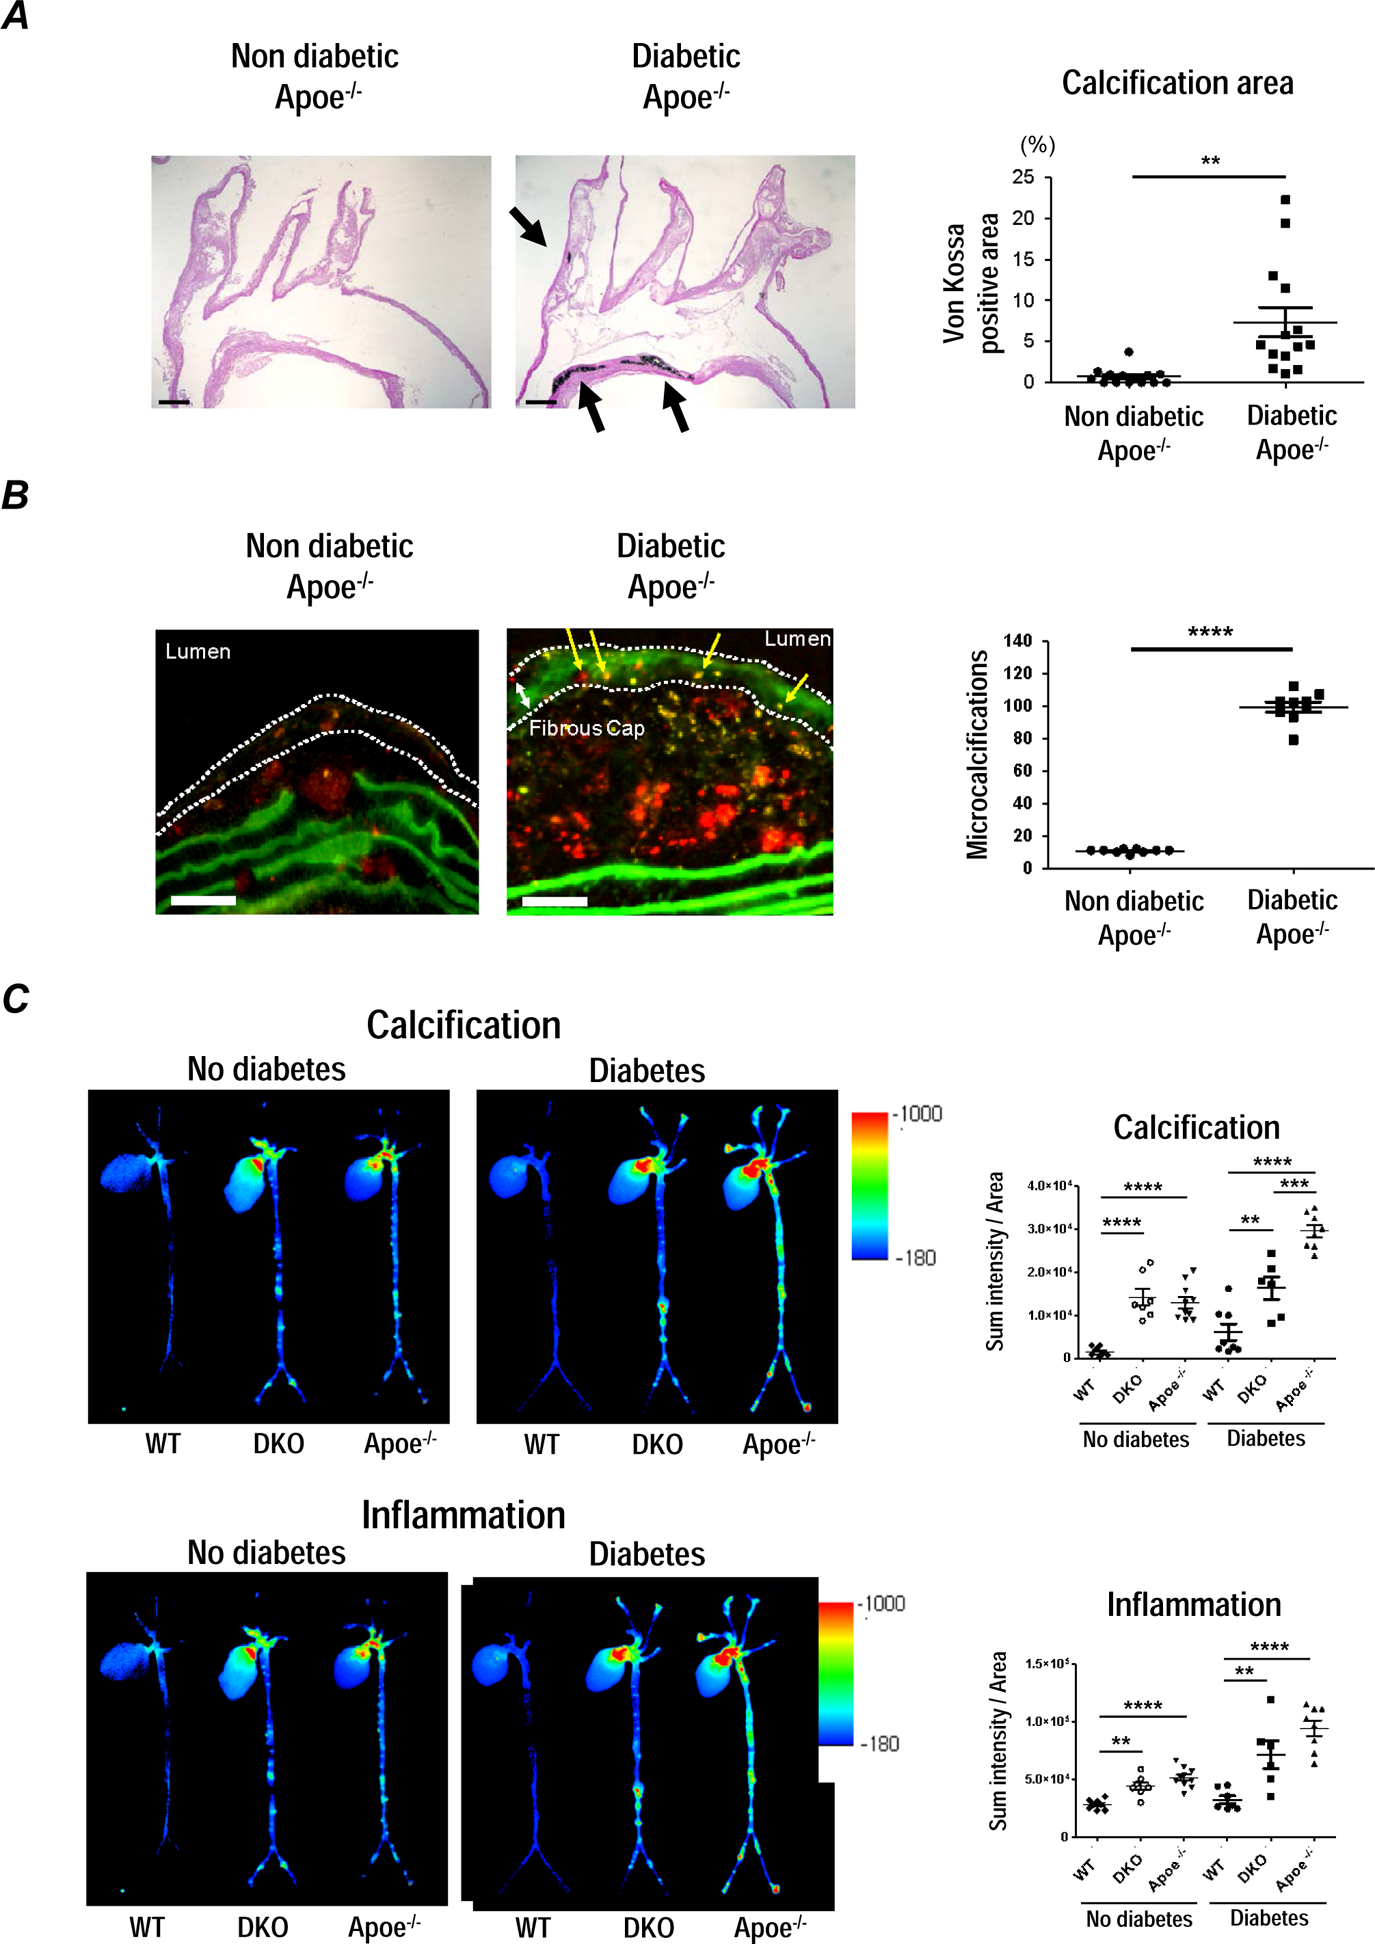
Figure 4. S100A9 deficiency attenuates calcific potential in atherosclerotic plaques in diabetic Apoe−/− mice.

Apoe−/− mice fed a HCD for 18 weeks. After 10 weeks, streptozotocin (42 mg/kg/day) was intraperitoneally injected to diabetic group for 5 days, and fed a HCD for 8 weeks. (A) Von Kossa staining on longitudinal sections of the aortic arch; one of 14 animals per group is shown. Scale bars: 200 μm. The graph shows the percentage of positive area in the plaques. (B) Microcalcifications (yellow arrows) within the fibrous cap (white dotted line) were detected by Near-infrared fluorescent (NIRF) calcium tracer (OS680). The graph shows the number of microcalcifications (n=9). Scale bars: 50 μm. (C) Molecular imaging of aortic vascular calcification assessed by OsteoSense750 and vascular inflammation assessed by proteolytic activity, ProSense680. (n=6–10). The graph shows the SUM intensity related to total aortic area for fluorescent reflection imaging (FRI) in Apoe+/+S100a9+/+ (wild type; WT), Apoe−/− S100a9−/− (double knockout; DKO), and Apoe−/− S100a9+/+ (Apoe−/−) mice with diabetes and non-diabetic control. P value was calculated by paired student’s t-test or two-way ANOVA followed by Bonferroni test. **P < 0.01, ***P < 0.001, ****P < 0.0001. Error bars indicate ± SEM.
