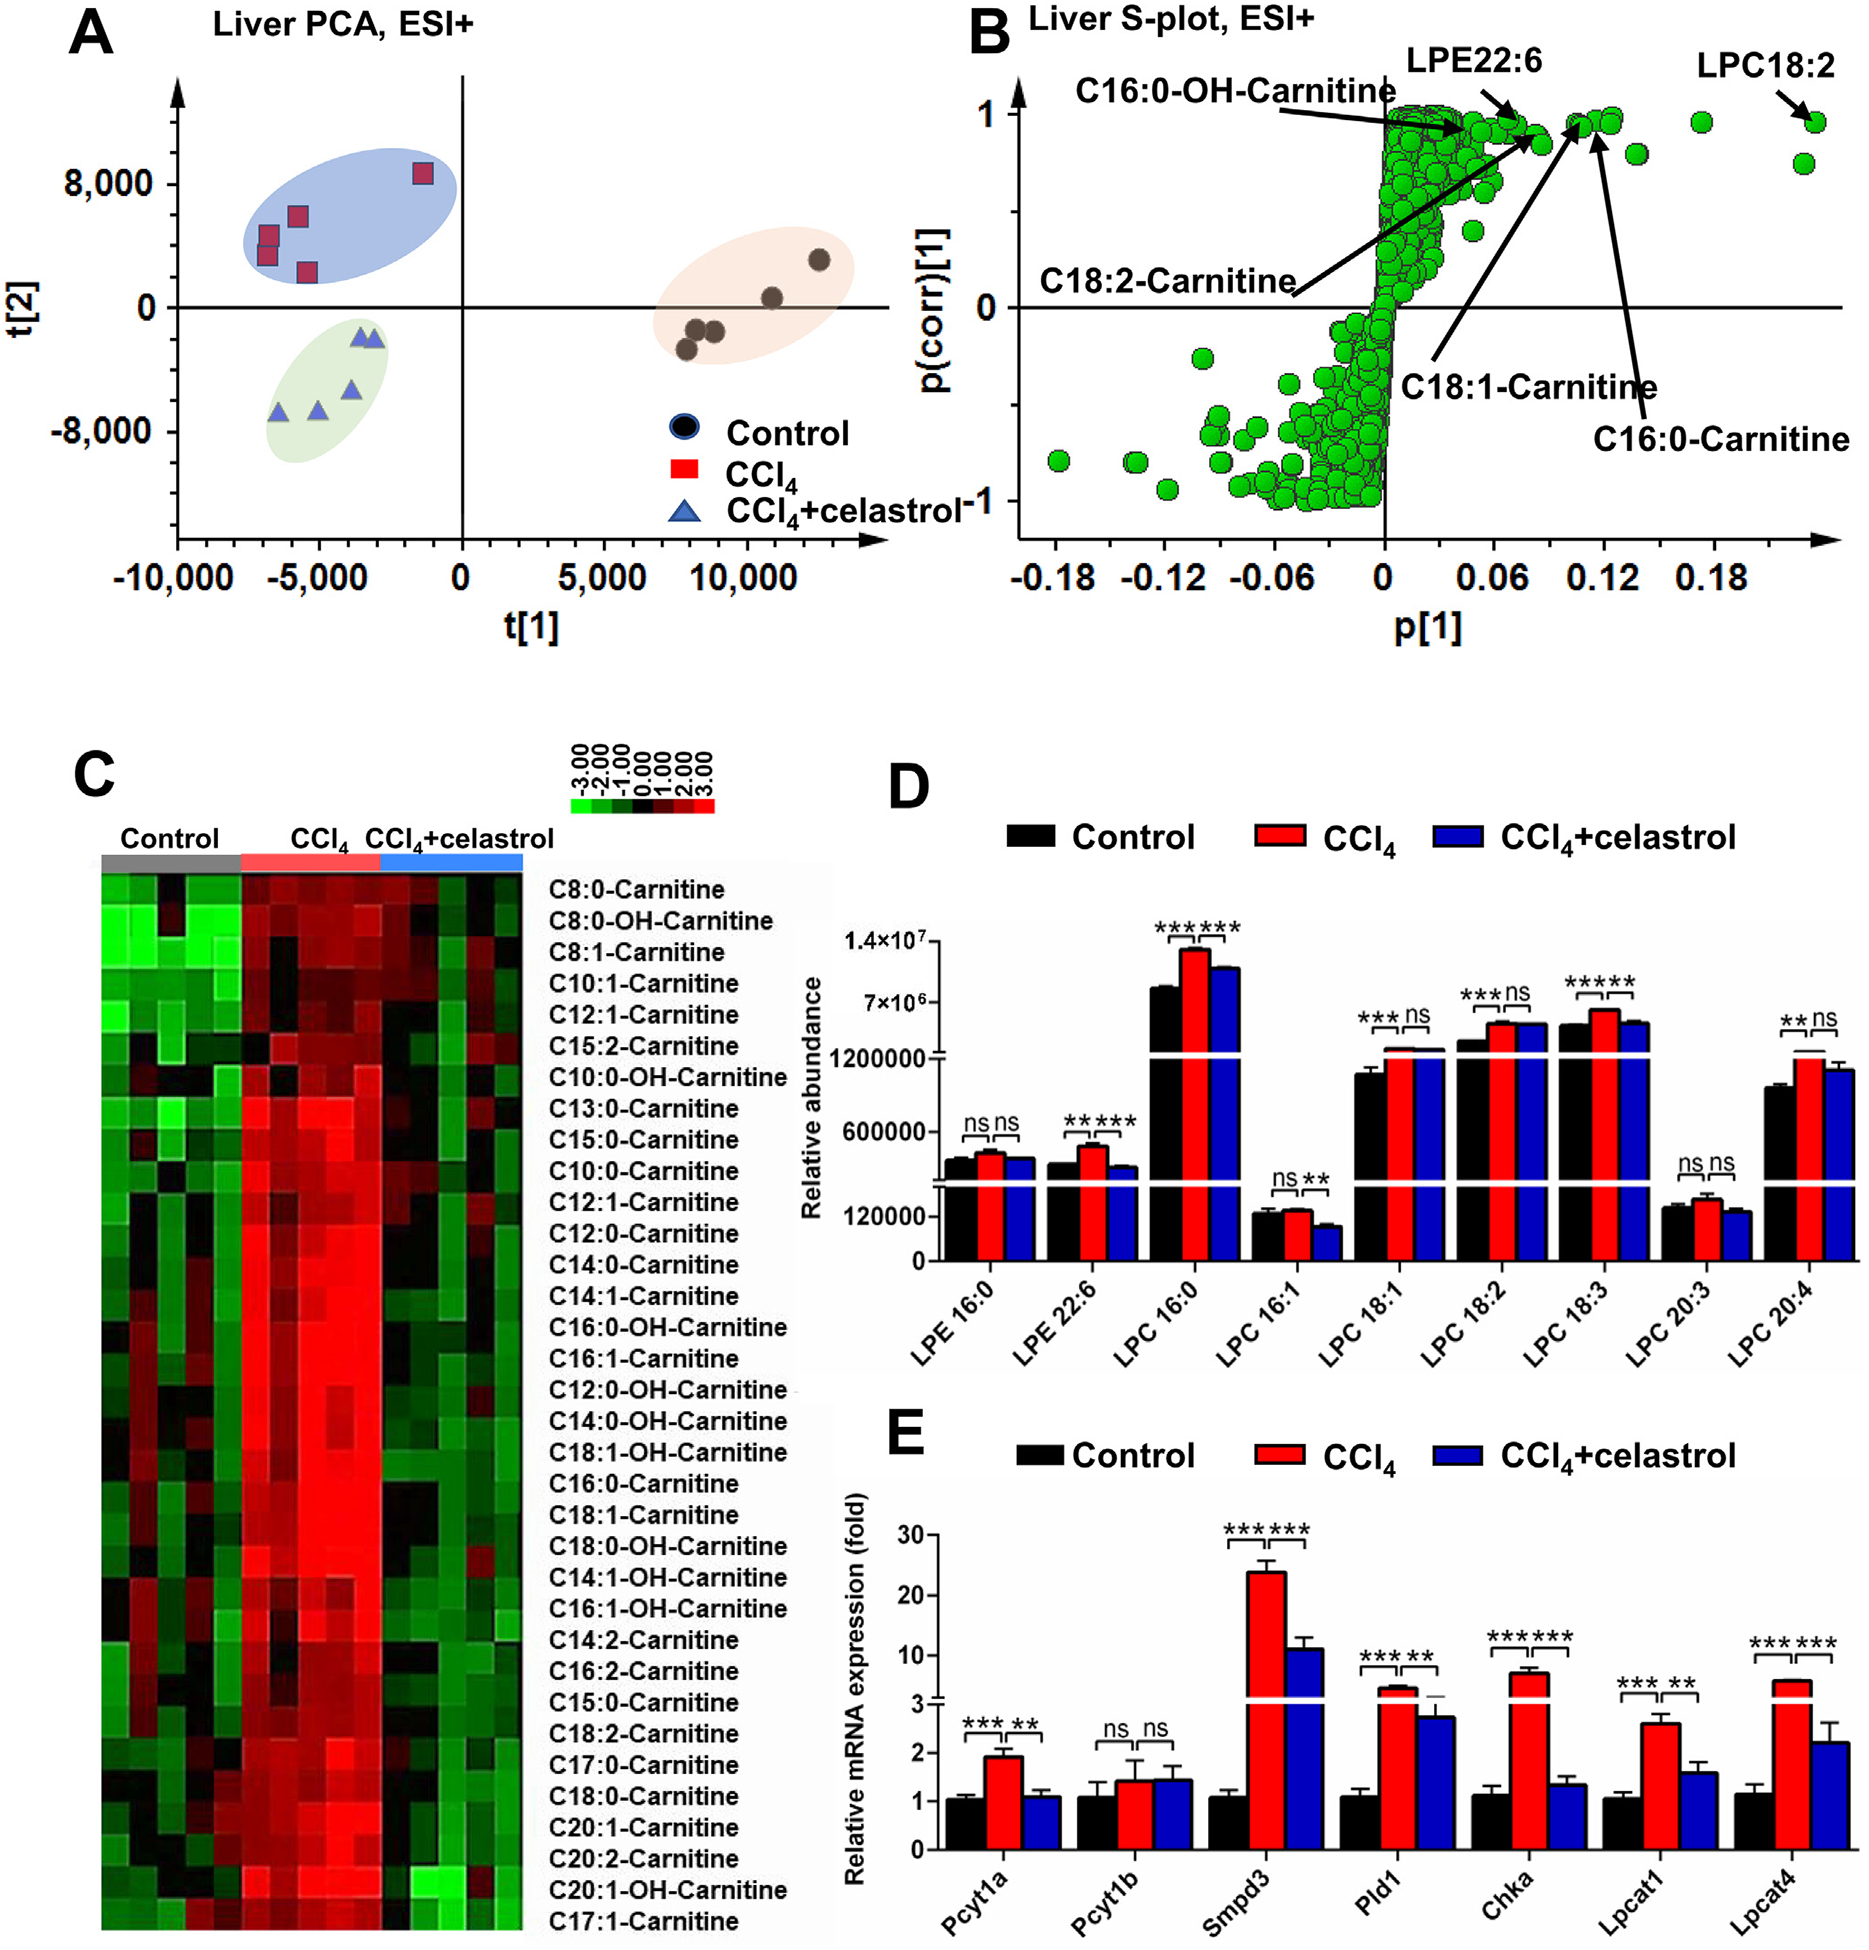
Fig. 3.

Celastrol decreased the accumulation of acylcarnitines and lipids induced by CCl4 in liver. PCA score plot (A) and OPLS-DA S-plot (B) derived from LC-MS data of hepatic ions in positive mode. Each point represented an individual mouse hepatic sample (-left) and an ion in the samples (-right). Metabolites were labeled in the S-plot (●, control group; ■, CCl4 group; ▲, CCl4 + celastrol group). (C) Heap map analysis of the relative abundance of medium- and long-chain acylcarnitines in liver of control, CCl4, and CCl4 + celastrol groups. (D) Celastrol decreased LPEs and LPCs levels in liver. (E) Lipid-related mRNAs were attenuated after celastrol treatment in liver. All data are expressed as mean ± SEM (n = 5). Values represent fold change after normalization to control. **P < 0.01, ***P < 0.001, ns = not significant.
