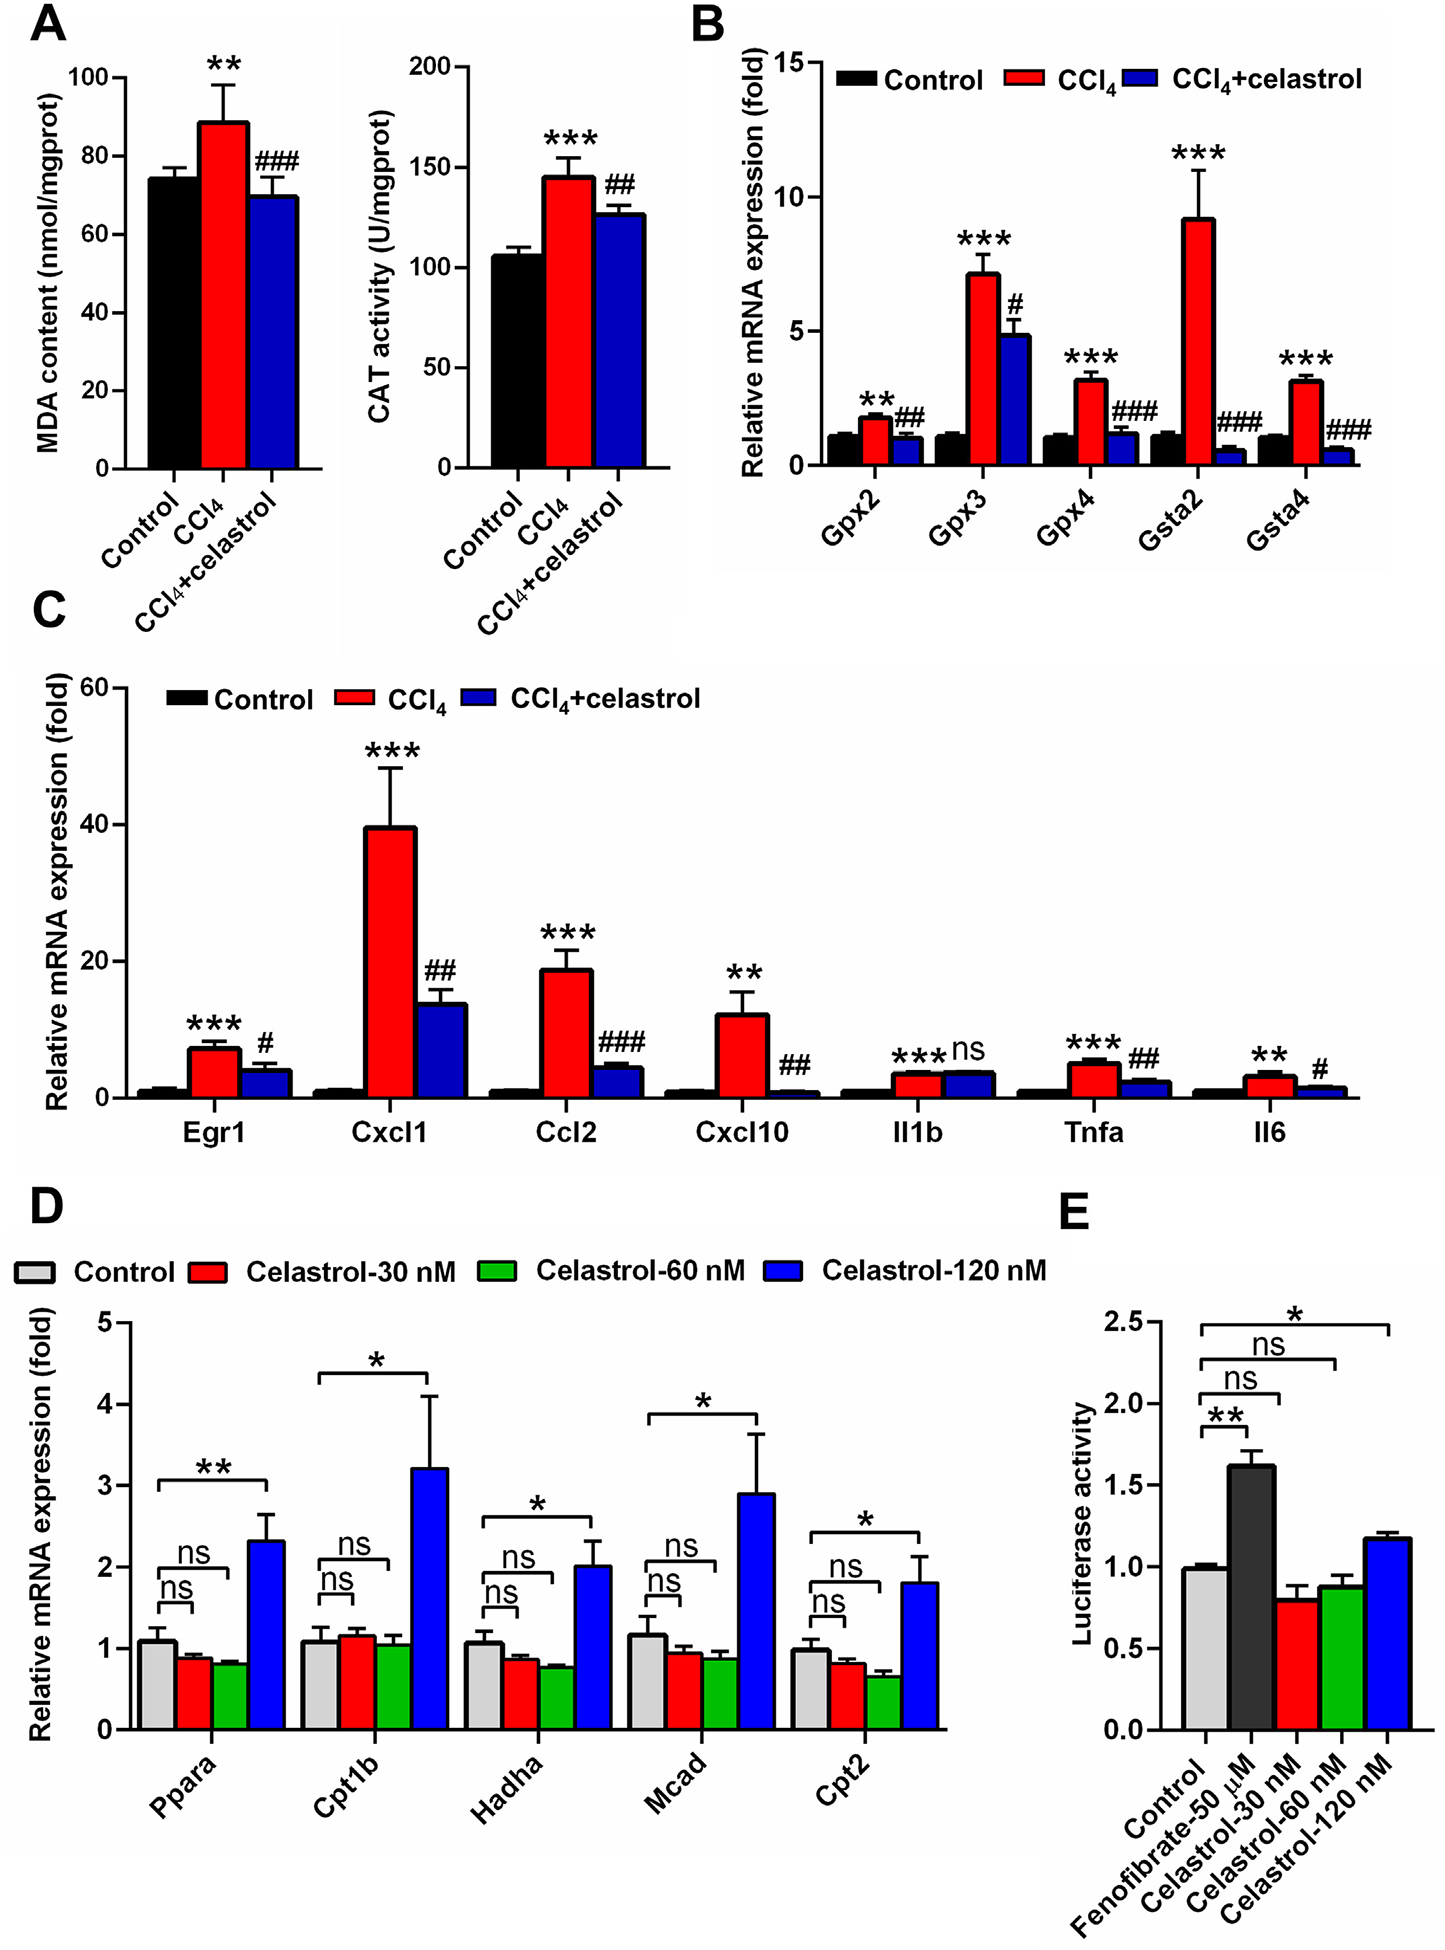
Fig. 4.

Celastrol eliminated oxidative stress and activated the PPARα signaling pathway. (A) Hepatic MDA and CAT levels in control, CCl4, and CCl4 + celastrol groups. (B) QPCR analysis of the mRNA expression of hepatic Gpx and Gst isoforms. (C) QPCR analysis of the mRNA expression of Egr1 and its downstream genes in liver. **P < 0.01 and ***P < 0.001 verse control; #P < 0.05, ##P < 0.01, ###P < 0.001, and ns means not significant verse CCl4. (D) QPCR analysis of the gene expression of PPARα and its target genes in primary mouse hepatocyte after celastrol treatment for 24 h in vitro. (E) Luciferase assays of the activation of PPARα in HEK293 cells. All data are expressed as mean ± SEM (n = 5). Values represent fold change after normalization to control. *P < 0.05, **P < 0.01, ns = not significant.
