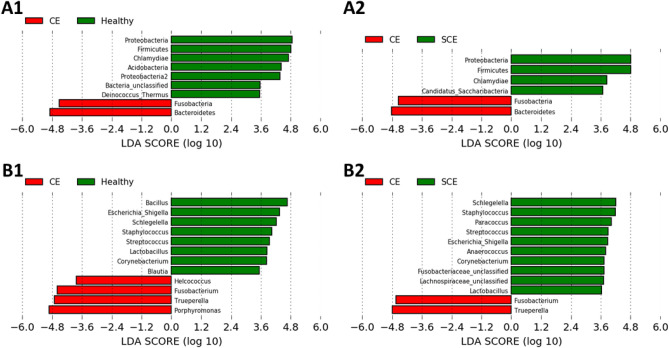
Figure 5.
Linear discriminant analysis (LDA) effect size plots showing the differences in uterine microbiota among cows diagnosed in the fifth week postpartum as healthy (n = 8), subclinical endometritis (SCE; n = 8; < 50% purulent vaginal discharge and > 5% endometrial neutrophils (PMN)), or with clinical endometritis (CE; n = 5; ˃ 50% purulent vaginal discharge and > 5% endometrial PMN). Histograms show the LDA effect size computed for features at the phyla (A1, A2) and genera (B1, B2) levels. Enriched features for healthy and SCE are indicated with positive LDA scores (green), and enriched features in CE cows are indicated with negative LDA scores (red). Only features with P ˃ 0.05 and an effect size cut-off of 3.5 are plotted.

