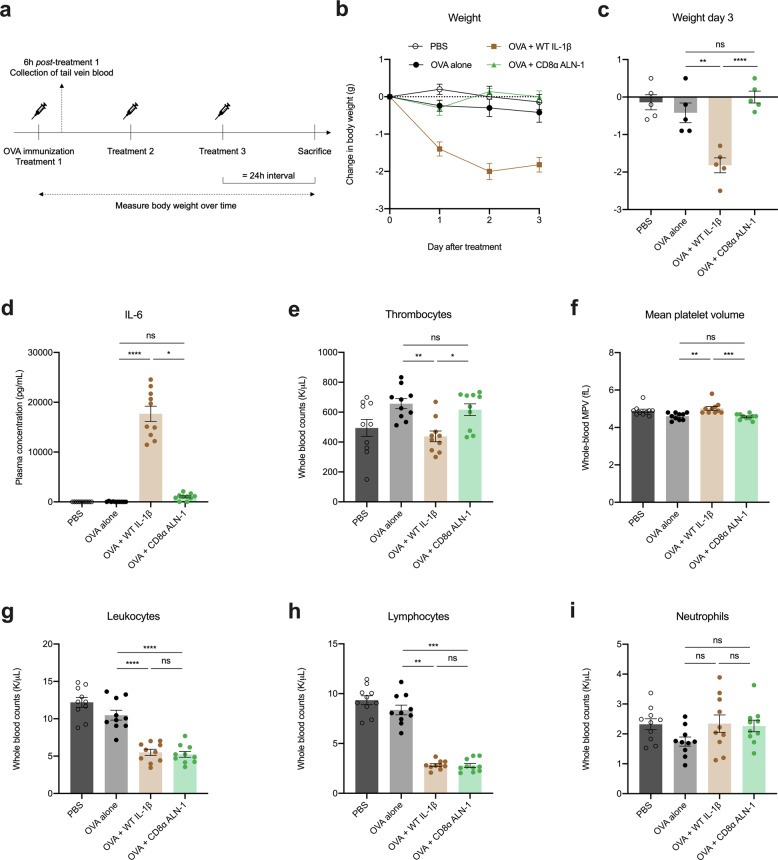
Fig. 4. Systemic treatment of mice with CD8α ALN-1 shows an improved safety profile compared with WT IL-1β.
a C57BL/6 mice received one i.p. OVA (100 μg) administration together with i.p. treatments with WT IL-1β (5 μg) or CD8α ALN-1 (10 μg) every 24 h for 3 days. Controls include mice treated with PBS or OVA alone. Tail vein blood was sampled 6 h after the first treatment and body weight was measured over time. Change in body weight over time (b) or after 3 days of treatment (c). Data points (b) and bars (c) represent the mean ± s.e.m. of a representative of two independent experiments with n = 5 mice/group. Hematological analysis of fresh EDTA-treated blood (e–i) or plasma derived from this blood (d), showing systemic IL-6 levels (d), platelet counts (e) and mean platelet volumes (f), total white blood cell counts (g), lymphocyte counts (h), and neutrophil counts (i). Bars represent the mean ± s.e.m. of a pool of two independent experiments with n = 10 mice/group combined. ****p < 0.0001; ***p < 0.001; **p < 0.01 *p < 0.05; ns, p ≥ 0.05 by one-way ANOVA with Tukey’s multiple comparisons test (c, g, i) or by Kruskal–Wallis test with Dunn’s multiple comparisons test (d–f, h). See also Supplementary Fig. 6.

