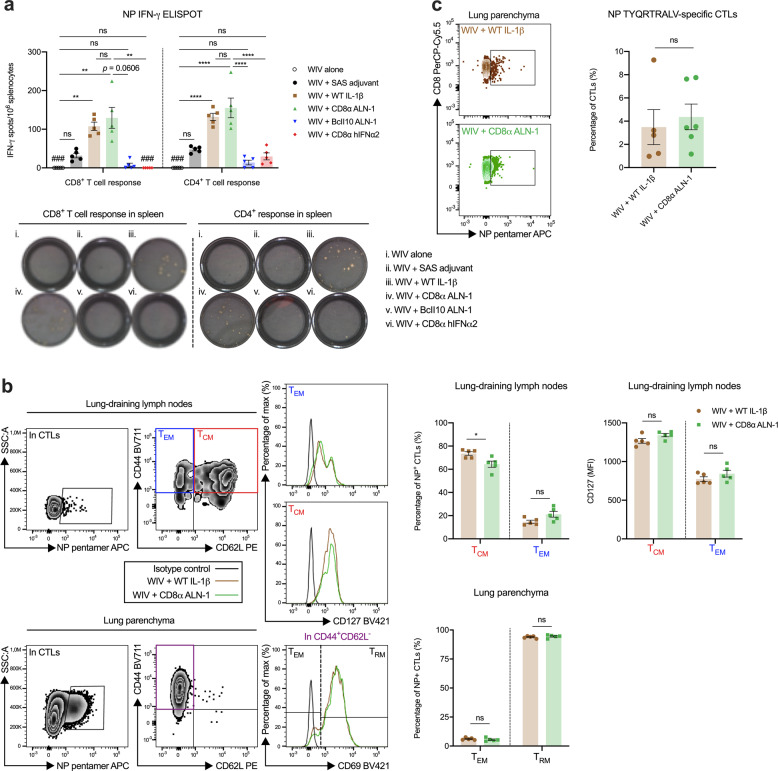
Fig. 6. The protective antiviral effect of CD8α ALN-1 correlates with the induction of strong and long-lasting influenza-specific T cell responses in lung and lymphoid tissues.
a Mice were vaccinated as described in Fig. 5a. Two weeks post boost, NP-specific CD8+ and CD4+ T cell responses in spleens of vaccinated mice were measured by IFN-γ ELISPOT. Representative ELISPOT pictures are shown, depicting numbers of spots after different vaccinations. Bars represent the mean ± s.e.m. of a representative of two independent experiments with n = 5 mice/group. Undetectable responses are indicated by triple hash symbol (###). b Detection and phenotyping of NP-specific CD8+ T cells in the lung-draining LNs and lung parenchyma of mice vaccinated with WIV and WT IL-1β or CD8α ALN-1, 7 days post pH1N1 influenza A virus infection. Bars represent the mean ± s.e.m. of a representative of two independent experiments with n = 5 mice/group. c Flow cytometric detection of NP-specific CD8+ T cells in the lungs of surviving mice that were vaccinated with WIV and WT IL-1β or CD8α ALN-1, 50 days post pH1N1 influenza A virus infection. Representative dot plots showing the fraction of NP-pentamer+ cells in the CTL population. Bars represent the mean ± s.e.m. of one experiment with n = 5 (WT IL-1β) or 6 (CD8α ALN-1) mice/group. ****p < 0.0001; **p < 0.01; *p < 0.05; ns, p ≥ 0.05 by Kruskal–Wallis test with Dunn’s multiple comparisons test in (a, CD8 ELISPOT) or by one-way ANOVA with Tukey’s multiple comparisons test (a, CD4 ELISPOT) or by unpaired Student’s t test (two-tailed) in b and c. See also Supplementary Fig. 7.

