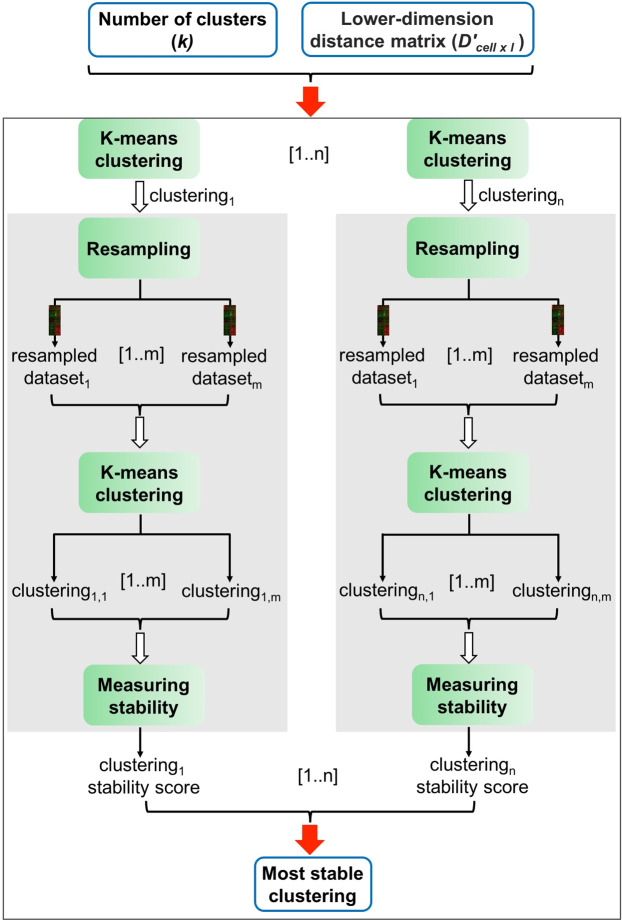
Figure 2.
Identifying the most stable clustering. In this analysis, given the lower-dimension distance matrix D′cell×l and the optimal number of clusters k, we calculate n different clusterings (clustering1, ..., clusteringn) using the k-means clustering algorithm. Then, the stability of each clustering is assessed based on a resampling approach (grey box). A stability score is assigned to each clustering based on how often its clusters are recovered when the input data is perturbed (resampled). A clustering with the maximum stability score is selected as the final solution.

