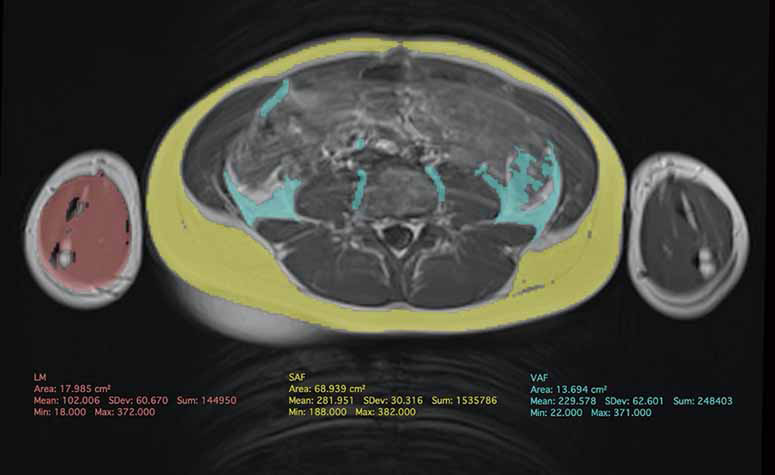
Figure 6.

MRI in a 10-year-old boy with unexplained chronic abdominal pain. Clinical examination, laboratory tests and US were normal. Single axial T1-weighted axial image at the level of the 3rd lumbar vertebra was used as proxy to perform quantification. Post-processing was performed with the semi-automatic free resource software Horos (https://horosproject.org) using the “brushing tool”. VAT (in green) can be distinguished from SAT (in yellow). The values are expressed in cm2 along with the LM (in red) of the arm as a proxy of the total lean mass.VAT, visceral adipose tissue; SAT, subcutaneous adipose tissue; LM, lean mass.
