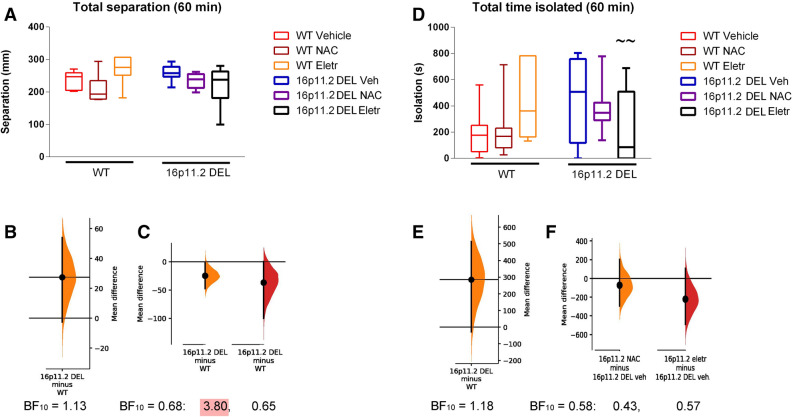
Figure 5.
Social interaction measures [distance of separation—(A)–(C)—and time spent isolated—(D)–(F)] during first 60 min after injection at start of dark phase. (A) Total separation: Effect of genotype: (F(1, 143) = 0.18; p = 0.67); effect of drug treatment: (F(1, 143) = 0.91, p = 0.41; genotype x drug interaction: (F(1, 143) = 3.14, p = 0.047. (B) The mean difference for separation in 60 min following vehicle injection between WT and 16p11.2 DEL mice, plotted as a bootstrap sampling distribution. The Bayes factor for the alternative hypothesis (BF10) of a difference between the vehicle-treated groups, is also shown. (C) The mean difference for separation for NAC compared to vehicle, and eletriptan compared to vehicle, groups, in 16p11.2 DEL mice only, are shown in the above Cumming estimation plot. The mean difference is plotted as a bootstrap sampling distribution. The Bayes factors (BF10) are also shown for one-way ANOVA of data from 16p11.2 DEL mice (left), and for post-hoc tests of NAC vs vehicle (middle) and eletriptan vs vehicle (right); red shading emphasises moderate evidence for an effect of NAC. (D) Time isolated: Effect of genotype: (F(1, 143) = 0.61; p = 0.44); effect of drug treatment: (F(1, 143) = 0.70, p = 0.50; genotype x drug interaction: (F(1, 143) = 6.96, p = 0.001; ~~p < 0.01 vs corresponding vehicle group, same genotype (post-hoc Tukey test). (E) The mean difference for time spent isolated in 60 min following vehicle injection between WT and 16p11.2 DEL mice, plotted on the right as a bootstrap sampling distribution. The Bayes factor for the alternative hypothesis (BF10), of a difference between the vehicle-treated groups, is also shown. (F) The mean difference for time isolated NAC compared to vehicle, and eletriptan compared to vehicle, groups, in 16p11.2 DEL mice only, are shown in the above Cumming estimation plot. The mean difference is plotted as a bootstrap sampling distribution. The Bayes factors (BF10) are also shown for one-way ANOVA of data from 16p11.2 DEL mice (left), and for post-hoc tests of NAC vs vehicle (middle) and eletriptan vs vehicle (right). In all cases, Box plots show interquartile range with “Tukey” whiskers. For effect size plots, the mean difference is depicted as a dot; the 95% confidence interval is indicated by the ends of the vertical error bar.

