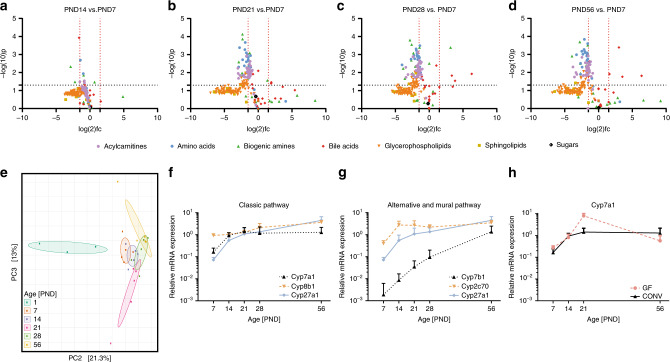
Fig. 2. Metabolic changes during the postnatal period.
a–d Volcano plots depicting acylcarnitines, glycerophospholipids, sphingolipids, sugars, bile acids, amino acids, and biogenic amines in liver tissue at PND14 vs. PND7 (a), PND21 vs. PND7 (b), PND28 vs. PND7 (c), and PND56 vs. PND7 (d) measured by mass spectrometry (n = 5 per group, two-tailed independent student’s t-test, fold-changes were calculated based on mean values by dividing the PNDx to PNDy concentrations and log2 the values). PND7 was selected as baseline for comparisons due to the high interindividual variation at PND1. e Principal Component Analysis (PCA) illustrating changes in the composition of the bile acid pool during the postnatal period. f–g Relative hepatic expression of the key-enzymes of (f) the classical (Cyp7a1, Cyp8b1, and Cyp27a1) and (g) the alternative and murine pathway (Cyp7b1, Cyp2c70, and Cyp27a1) (n = 5 per group, mean and SD). h Relative expression of Cyp7a1 in total liver tissue of germ-free (GF) and conventionally (CONV) raised mice (n = 5 per group, mean and SD). Source data are provided as a Source Data file.

