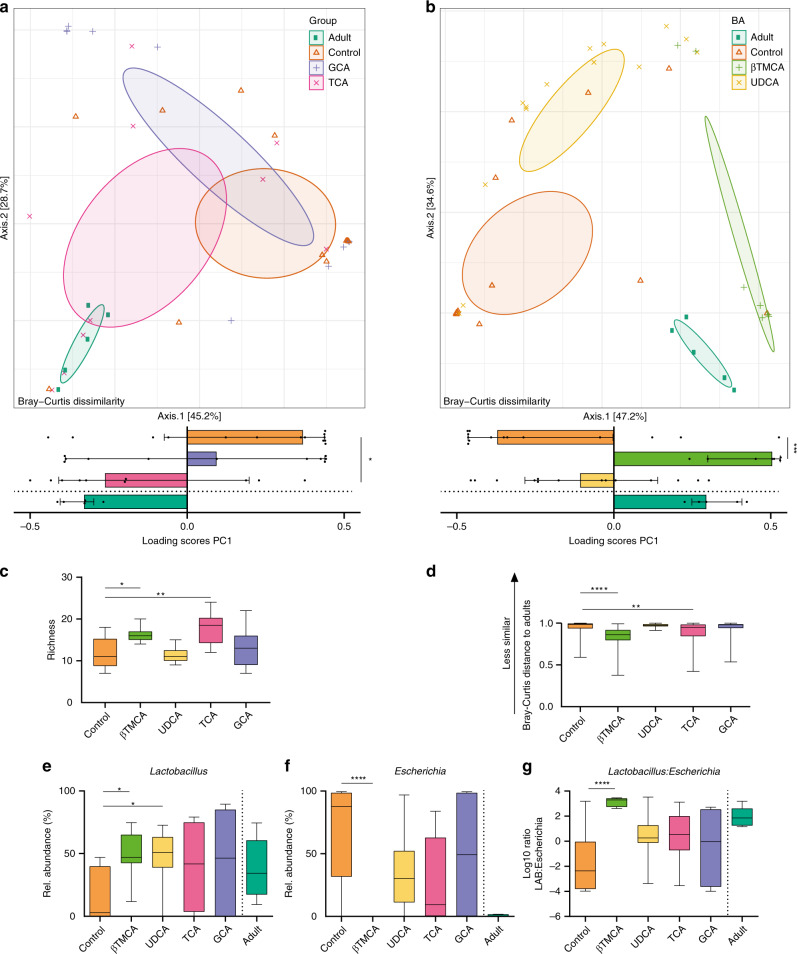
Fig. 4. Oral administration of bile acids to neonate mice accelerates microbial maturation.
a, b PCoA (upper panels) and scores of the 1st axis (lower panels) based on Bray–Curtis dissimilarity indicating shifts in microbial community structure in the small intestine of adult mice (Adult, dark green), untreated neonate mice (Control, orange), and neonate mice after oral administration of (a) GCA (violet) or TCA (pink) and (b) βTMCA (light green) or UDCA (yellow) (Kruskal–Wallis test to controls with Dunn’s post-test and correction for multiple comparisons, median +/− interquartile range; *p = 0.0307; ***p = 0.0001, two-sided. n = 14 for UDCA and Control, n = 11 for GCA, n = 10 for TCA, n = 7 for βTMCA, n = 5 for Adult, and for subsequent analyses in this figure). c Richness (observed species) of the intestinal microbiota of untreated mice (Control) and mice after oral administration of GCA, TCA, βTMCA or UDCA (Kruskal-Wallis test to controls with Dunn’s post-test and correction for multiple comparisons, box represents IQR with median, whiskers represent minimum and maximum values; *p = 0.0319; **p = 0.0042, two-sided). d Bray-Curtis distance of untreated neonate mice (Control) and neonate mice after oral administration of GCA, TCA, βTMCA, or UDCA compared to adult animals (Kruskal–Wallis test to controls with Dunn’s post-test and correction for multiple comparisons, box represents IQR with median, whiskers represent minimum and maximum values; **p = 0.0026; ****p < 0.0001, two-sided). e–g Relative abundance of the two most abundant genera Lactobacillus and Escherichia (e, f) and ratio of the abundance of Lactobacillus OTUs to Escherichia OTUs (g) in the microbiota of untreated neonate mice (Control) as compared to neonate mice after oral administration of GCA, TCA, βTMCA or UDCA (Kruskal-Wallis test to controls with Dunn’s post-test and correction for multiple comparisons, box represents IQR with median, whiskers represent minimum and maximum values; *p = 0.02; ****p < 0.0001, two-sided). The abundance of these genera (e, f) and the ratio of the abundance of Lactobaccillus OTUs to Echerichia OTUs (g) in adult mice (Adult) was added to allow visual comparison but was not included in the statistical evaluation (n = 5). Source data are provided as a Source Data file.

