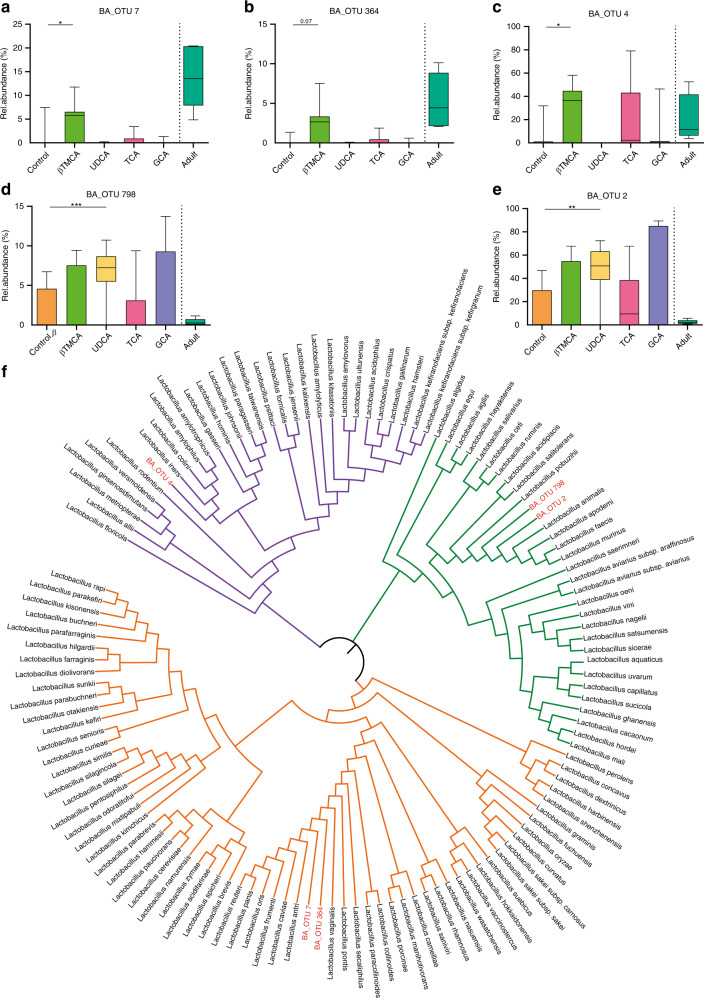
Fig. 5. Differences in the impact of bile acids on the phylogenetic lactobacillus clusters.
a–e Relative abundance of the Lactobacillus OTUs (a) BA OTU 7, (b) BA_OTU 364, (c) BA_OTU 4, (d) BA_OTU 798, and (e) BA_OTU 2 (Kruskal–Wallis test to controls with Dunn’s post-test and correction for multiple comparisons, box represents IQR with median, whiskers represent minimum and maximum values; (a)*, p = 0,0104; (c)*, p = 0,0161; **p = 0,0091; ***p = 0,0008, two-sided, n = 14 for UDCA and Control, n = 11 for GCA, n = 10 for TCA, n = 7 for βTMCA, n = 5 for Adult, and for subsequent analyses in this figure) in the small intestinal microbiota of adult mice (Adult), untreated neonate mice (Control) and neonate mice after oral administration of GCA, TCA, βTMCA, or UDCA. f Phylogenetic tree of lactobacilli (Ezbiocloud) based on the 16S rDNA gene. The three colored branches indicate the main clusters; identified OTUs are assigned to the clusters and highlighted in red (purple, BA_OTU 4; green, BA_OTU 798 and BA_OTU 2; orange, BA_OTU 7 and BA_OTU 364). The phylogentic tree was constructed by MEGA7 version 7.0.21 (MUSCLE) for alignment and iTOL v4 for the final annotations. Source data are provided as a Source Data file.

